Fig. 10.
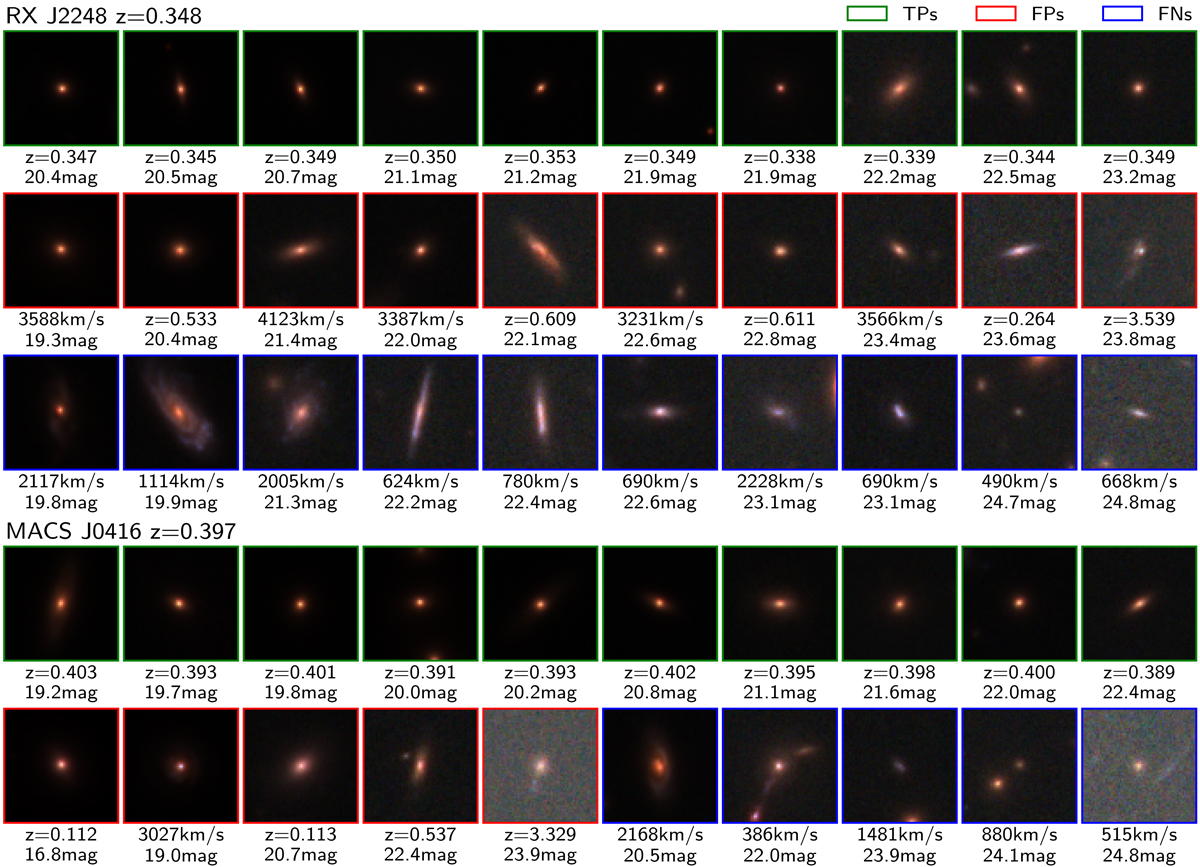
Ensemble of object cut-outs with a size of 64 pixels (∼4″), corresponding to some specific CNN predictions in the clusters R2248 (first three rows) and M0416 (last two rows). The True Positives (TPs), i.e. the CLMs correctly identified, are shown on first and fourth row with green boxes, while False Positive and False Negative (FPs and FNs) are shown on the second, third and fifth row, framed by red and blue boxes, respectively. The images were obtained by combining five HST bands: F435, F606, F814, F105, F140. The figure shows sources in the F814 band with a magnitude F814 ≤ 25 mag. TPs are shown together with their spectroscopic redshift, while FNs together with their cluster rest-frame velocity separation. For convenience, in the case of FPs, their cluster velocity separations are quoted when within ±9000 km s−1, otherwise their redshift is shown.
Current usage metrics show cumulative count of Article Views (full-text article views including HTML views, PDF and ePub downloads, according to the available data) and Abstracts Views on Vision4Press platform.
Data correspond to usage on the plateform after 2015. The current usage metrics is available 48-96 hours after online publication and is updated daily on week days.
Initial download of the metrics may take a while.