Fig. 9.
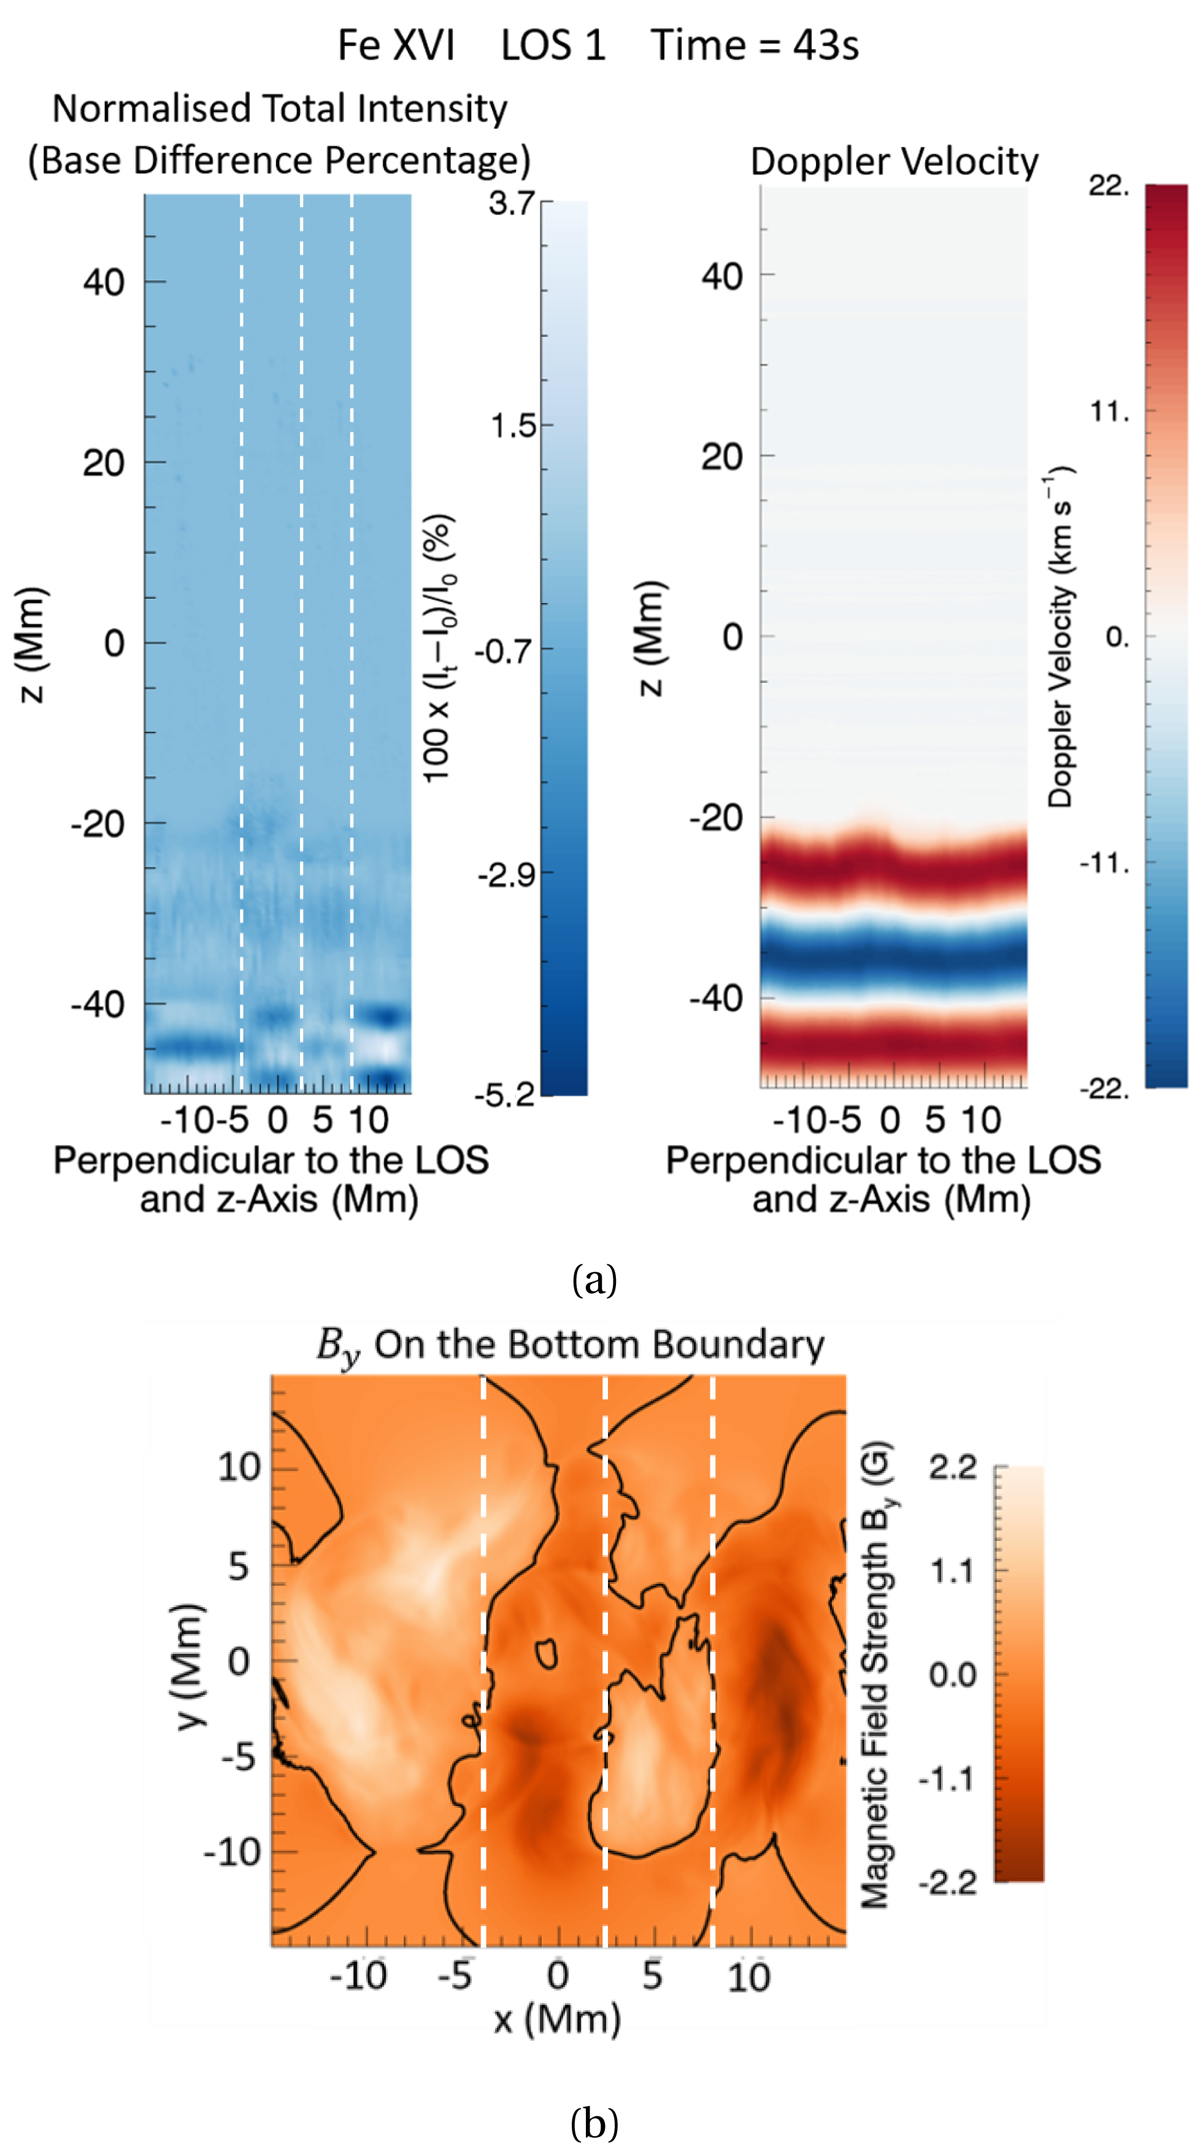
First and second panel of (a) illustrate the total relative intensity base difference and Doppler velocity, respectively, in Fe XVI along LOS1 in S2. Depicted in (b) is By on the bottom z boundary. The black line represents the By = 0 G contour. In (a) and (b) the white dashed lines highlight the location of the small horizontal spatial features. All panels are at 43 s.
Current usage metrics show cumulative count of Article Views (full-text article views including HTML views, PDF and ePub downloads, according to the available data) and Abstracts Views on Vision4Press platform.
Data correspond to usage on the plateform after 2015. The current usage metrics is available 48-96 hours after online publication and is updated daily on week days.
Initial download of the metrics may take a while.