Fig. 21.
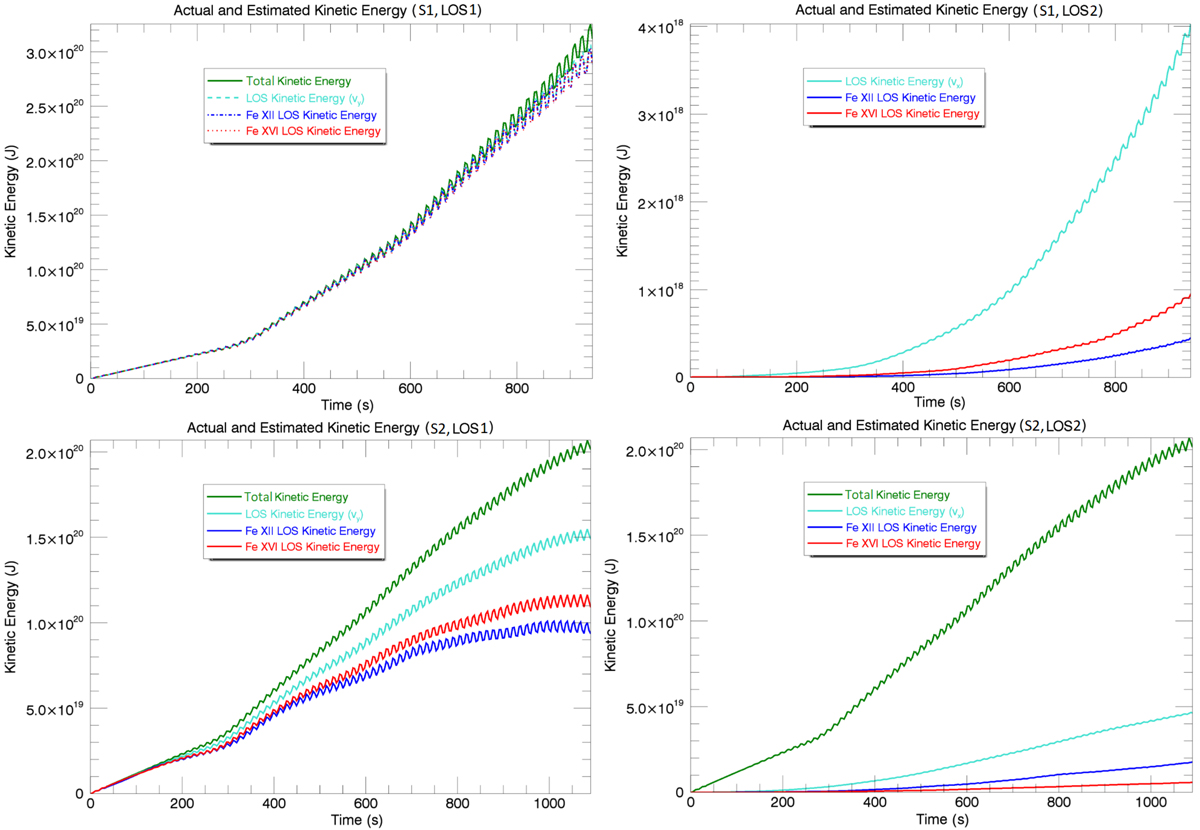
Total (green) and LOS (turquoise) kinetic energy is integrated over the full 3D numerical domain compared to the estimated kinetic energy in Fe XII (blue) and Fe XVI (red), during S1 (row 1) and S2 (row 2) along LOS1 (column 1) and LOS2 (column 2). All curves have been smoothed to illustrate the general trend rather than the amplitude of the oscillations. The total kinetic energy has not been plotted in panel b as it is several orders of magnitude larger (but the total kinetic energy is the same as in panel a).
Current usage metrics show cumulative count of Article Views (full-text article views including HTML views, PDF and ePub downloads, according to the available data) and Abstracts Views on Vision4Press platform.
Data correspond to usage on the plateform after 2015. The current usage metrics is available 48-96 hours after online publication and is updated daily on week days.
Initial download of the metrics may take a while.