Free Access
Fig. 16.
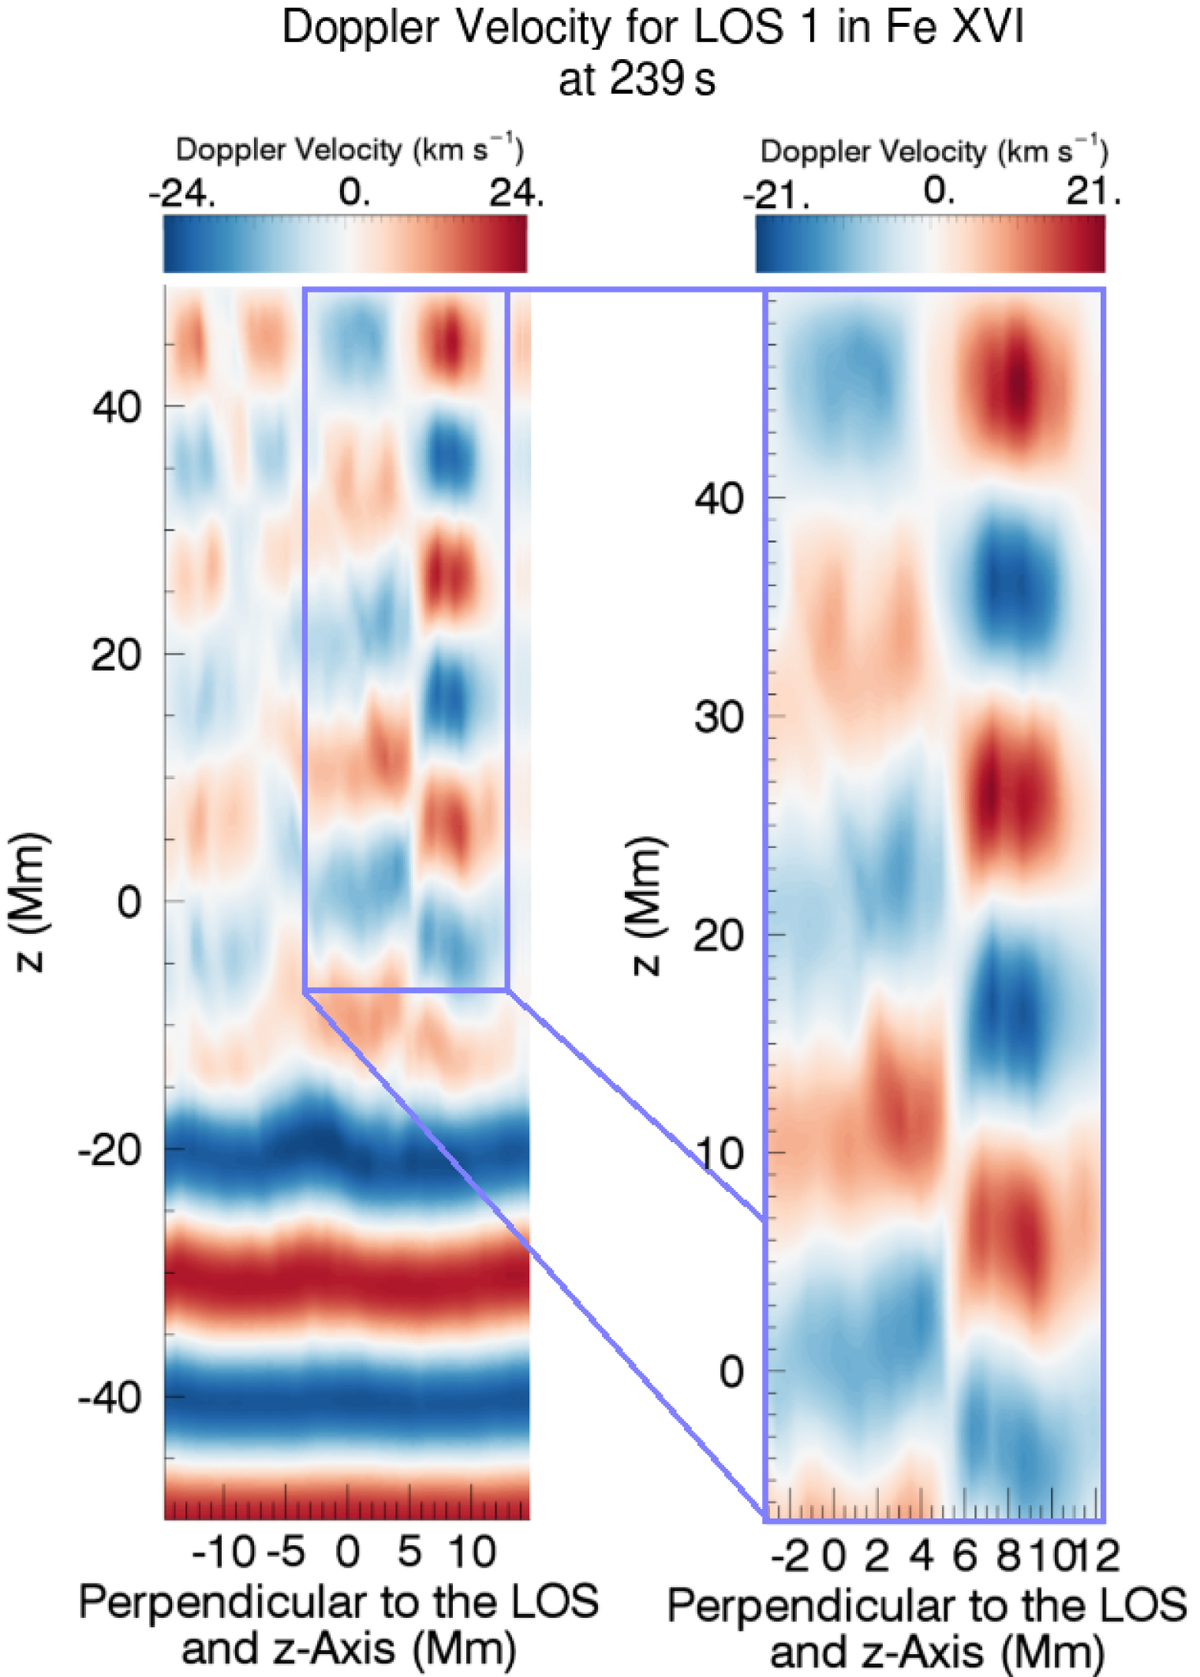
Doppler velocity for S2 along LOS1 in Fe XVI (left panel), repeated from panel 2 of Fig. 13. A zoomed in region of the domain (right panel) where −7 Mm ≤ z ≤ 50 Mm and the other axis is between −3 Mm and 12 Mm. The range of the colour bars change between each panel.
Current usage metrics show cumulative count of Article Views (full-text article views including HTML views, PDF and ePub downloads, according to the available data) and Abstracts Views on Vision4Press platform.
Data correspond to usage on the plateform after 2015. The current usage metrics is available 48-96 hours after online publication and is updated daily on week days.
Initial download of the metrics may take a while.