Fig. 7.
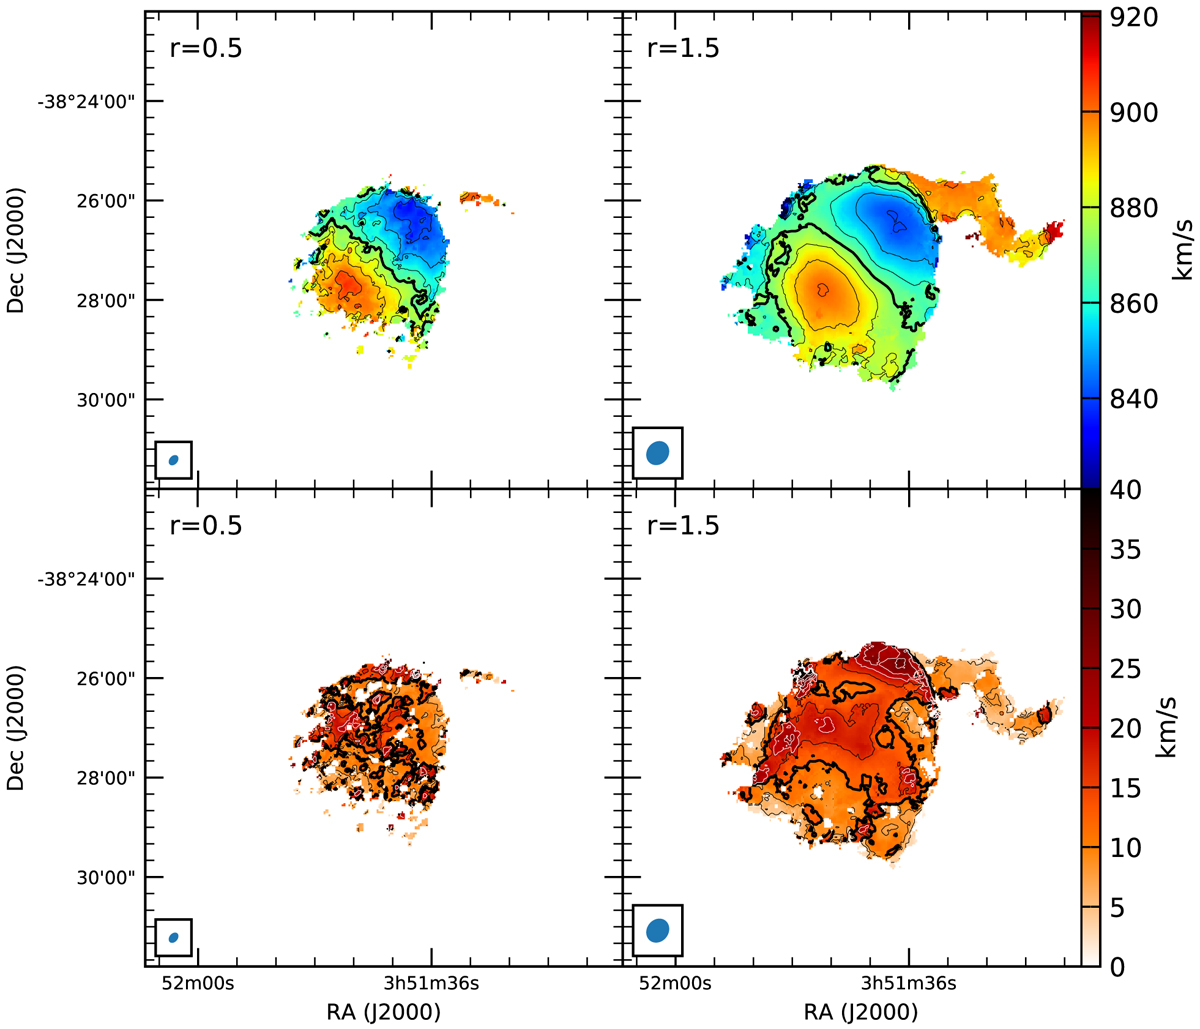
First- and second-moment maps of the galaxy ESO 302-G014 based on the MeerKAT 32k data. Top row: intensity-weighted mean velocity fields, bottom row: velocity dispersion maps. Left column: r = 0.5 map, right column: r = 1.5 version. An intensity cut has been applied to the maps. Left column: only velocities where the column density is above 1 × 1020 cm−2. Right column: the limit is 1 × 1019 cm−2. Top row: the thick contour denotes a velocity of 871 km s−1 (the systemic velocity). From there contours are shown in intervals of 10 km s−1. Bottom row: the thick contour indicates 12 km s−1. Contour values change in intervals of 4 km s−1. The highest values are indicated by white contours.
Current usage metrics show cumulative count of Article Views (full-text article views including HTML views, PDF and ePub downloads, according to the available data) and Abstracts Views on Vision4Press platform.
Data correspond to usage on the plateform after 2015. The current usage metrics is available 48-96 hours after online publication and is updated daily on week days.
Initial download of the metrics may take a while.