Free Access
Fig. 6.
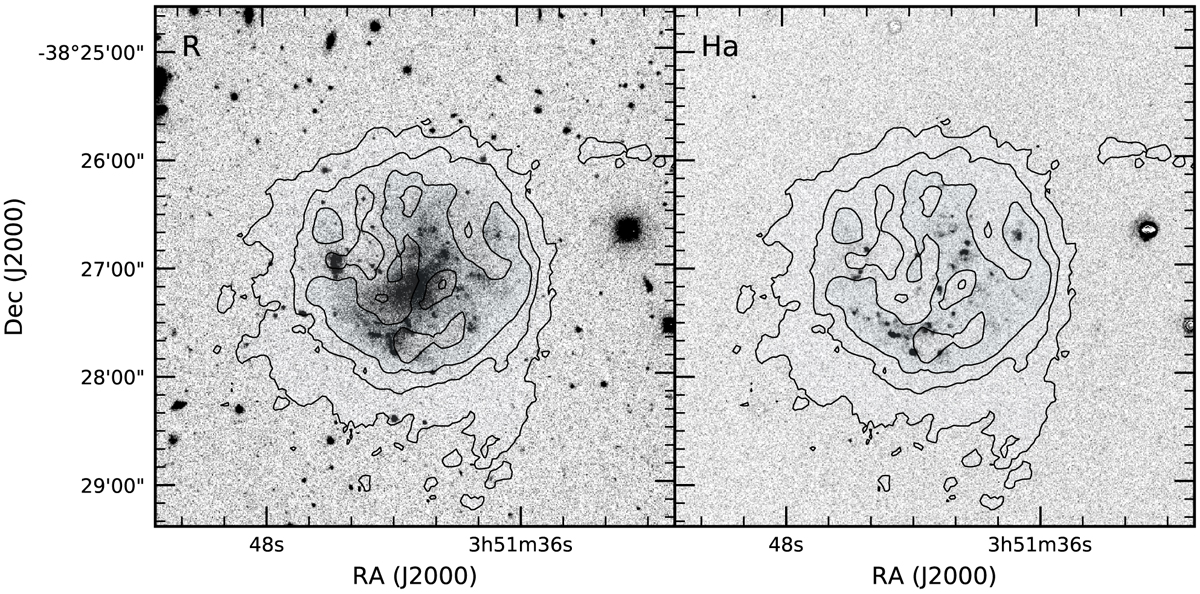
Overlays of the MeerKAT r = 0.5 integrated H I map on SINGG R-band (left panel) and Hα (right panel) images. For clarity, only a limited number of column density contours are shown. These are (1.0, 5.0, 10.0)×1020 cm−2. Darker shading indicates the highest column densities.
Current usage metrics show cumulative count of Article Views (full-text article views including HTML views, PDF and ePub downloads, according to the available data) and Abstracts Views on Vision4Press platform.
Data correspond to usage on the plateform after 2015. The current usage metrics is available 48-96 hours after online publication and is updated daily on week days.
Initial download of the metrics may take a while.