Fig. 12.
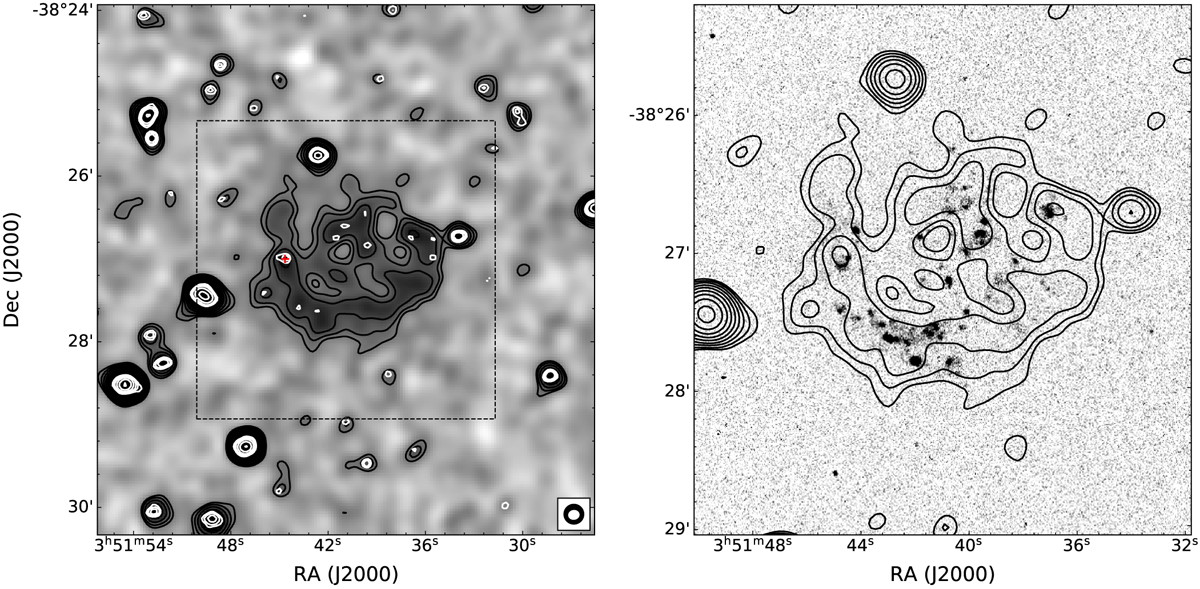
Comparison between radio continuum and Hα emission. Left panel: grayscale shows the radio continuum image smoothed to 15″ resolution, and the black contours are from the same map starting at 3σ and increasing by powers of ![]() . White contours are for the full-resolution continuum image starting at 4σ and increasing by powers of
. White contours are for the full-resolution continuum image starting at 4σ and increasing by powers of ![]() up to 8σ and then by powers of two thereafter. The beam sizes of the radio continuum images are shown in the bottom right corner, with colors corresponding to their contours. The position of SN2008jb is shown with a red cross. Right panel: Hα image from Meurer et al. (2006) in grayscale, within the region indicated by the dashed square in the left panel, and overlaid with the same 15″-resolution radio continuum contours as in the left panel.
up to 8σ and then by powers of two thereafter. The beam sizes of the radio continuum images are shown in the bottom right corner, with colors corresponding to their contours. The position of SN2008jb is shown with a red cross. Right panel: Hα image from Meurer et al. (2006) in grayscale, within the region indicated by the dashed square in the left panel, and overlaid with the same 15″-resolution radio continuum contours as in the left panel.
Current usage metrics show cumulative count of Article Views (full-text article views including HTML views, PDF and ePub downloads, according to the available data) and Abstracts Views on Vision4Press platform.
Data correspond to usage on the plateform after 2015. The current usage metrics is available 48-96 hours after online publication and is updated daily on week days.
Initial download of the metrics may take a while.