Fig. 10.
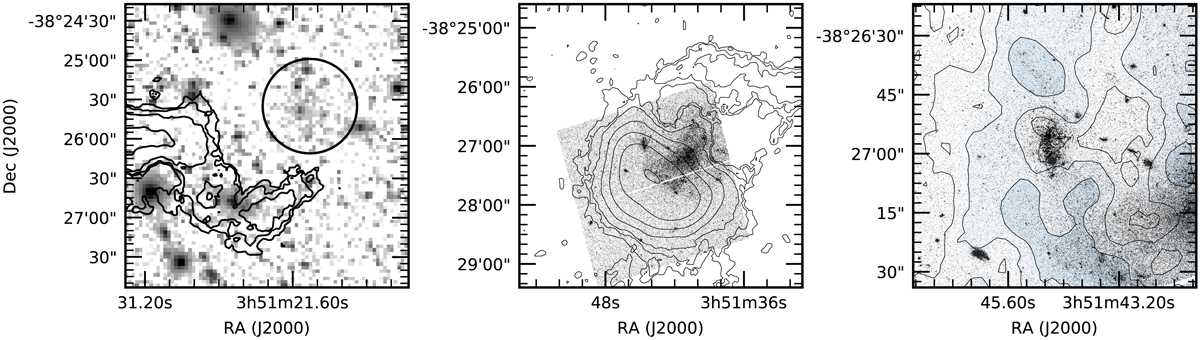
Left panel: overlay of the r = 1.5, 32k integrated H I map on a combined g + r image from DECaLS, binned to a pixel size of 2.7″ to increase signal-to-noise. Contour levels are as in Fig. 5. The circle indicates the dwarf galaxy candidate. Middle panel: contours show the zeroth-moment map of emission > 2σ in the three channels between 892.5 and 903.6 km s−1 in the r = 0.5 32k cube. Levels are (2.5, 5, 10, 25, 50, 100, 250)⋅σmom, where σmom = 1.3 × 1019 cm−2. Right panel: zoom-in of the HST image centered on the stellar clusters. Contours represent the r = 0.0 zeroth-moment map. Contour levels are (2.0, 5.0, 10.0)×1020 cm−2.
Current usage metrics show cumulative count of Article Views (full-text article views including HTML views, PDF and ePub downloads, according to the available data) and Abstracts Views on Vision4Press platform.
Data correspond to usage on the plateform after 2015. The current usage metrics is available 48-96 hours after online publication and is updated daily on week days.
Initial download of the metrics may take a while.