Fig. 9.
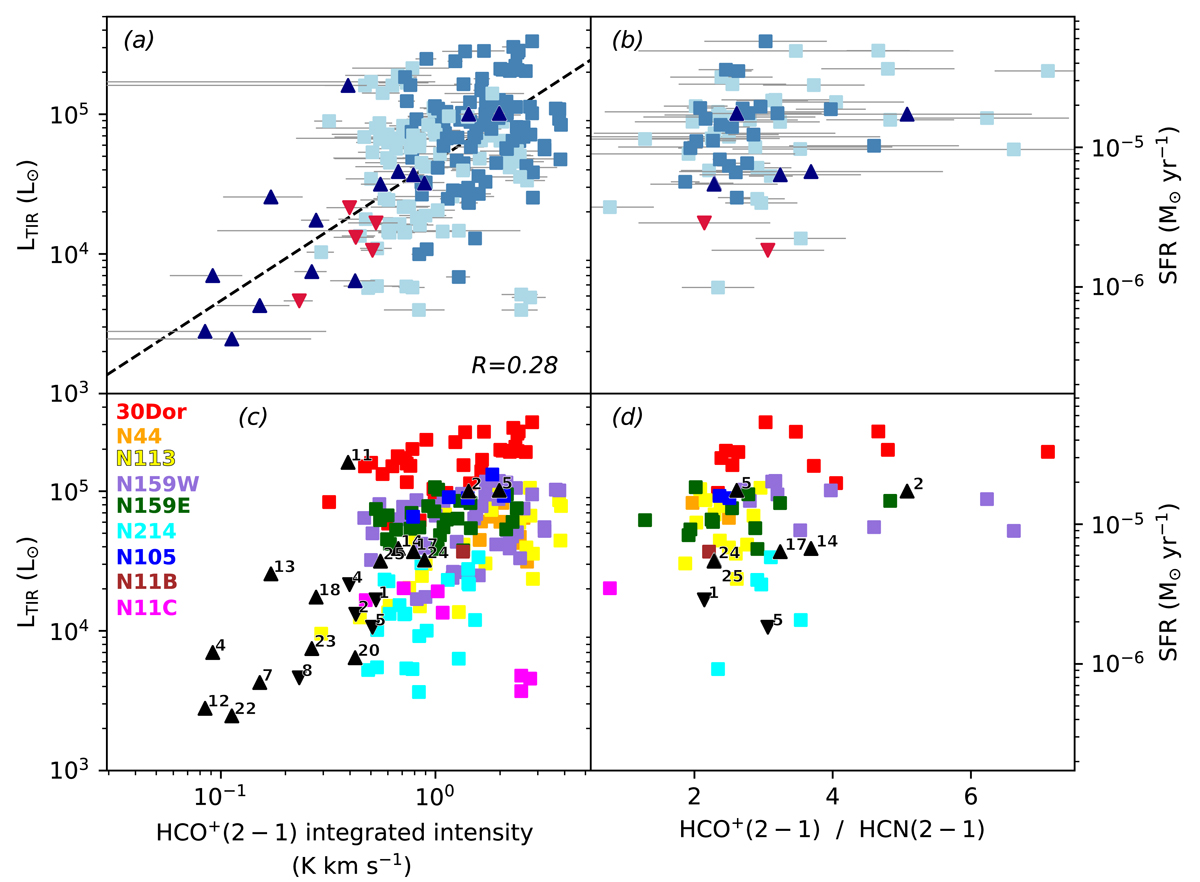
Panels a and b: variation of the HCO+(2−1) intensity and the HCO+(2−1)/HCN(2−1) ratio as a function of the SFR traced by LTIR for the LMC (blue upward triangles) and SMC (red downward triangles) pointings. Intensities are in units of K km s−1. The light and dark blue squares indicate the individual detections from the LMC spectral maps (18″ pixels) detected at a 3 and 5-σ level, respectively. Panel a: the dashed line indicates the linear fit to the data. The Pearson’s correlation coefficient is indicated Panels c and d: same but with colors indicating the star-forming region of each resolved element. Black triangles indicate LMC and SMC pointings shown with their corresponding DeGaS-MC numbers.
Current usage metrics show cumulative count of Article Views (full-text article views including HTML views, PDF and ePub downloads, according to the available data) and Abstracts Views on Vision4Press platform.
Data correspond to usage on the plateform after 2015. The current usage metrics is available 48-96 hours after online publication and is updated daily on week days.
Initial download of the metrics may take a while.