Fig. 7.
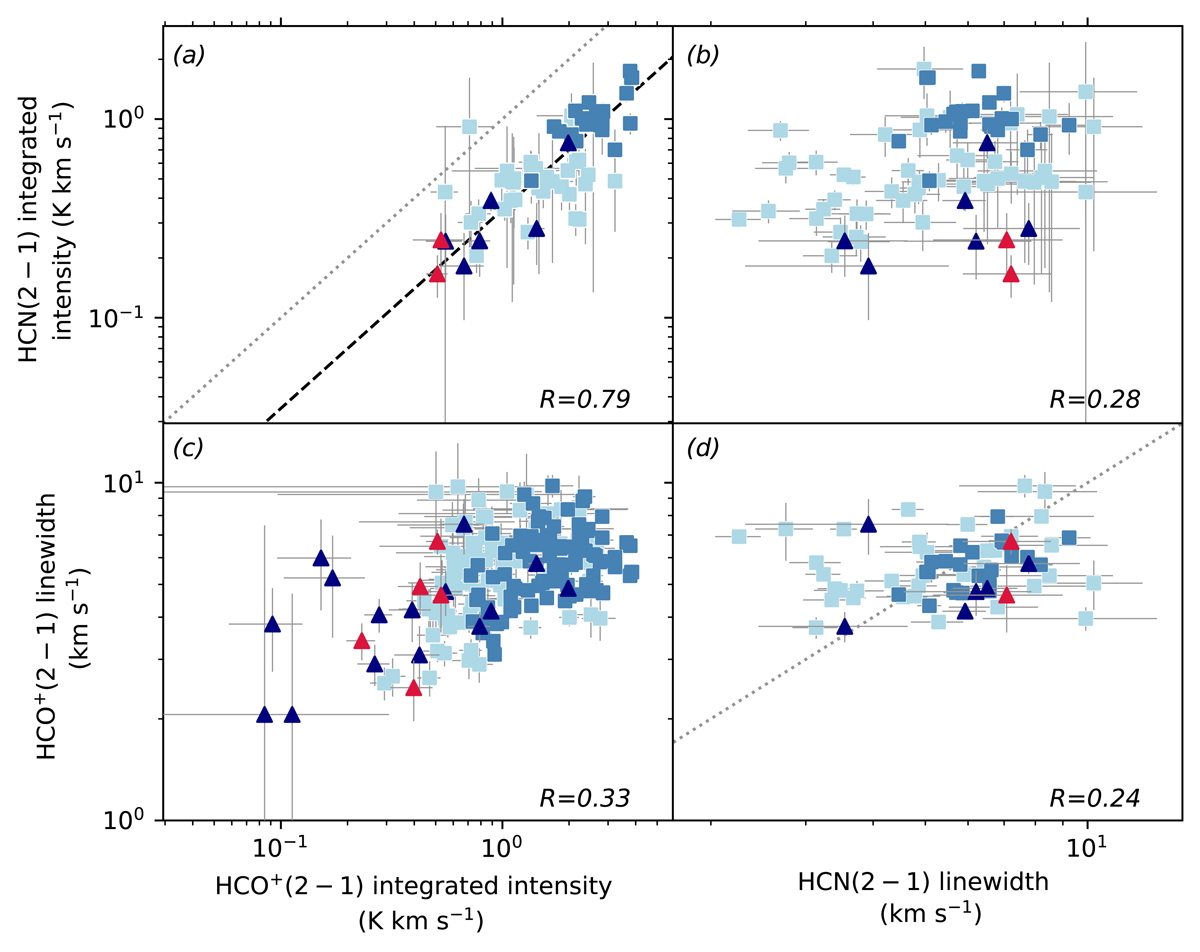
Relations between the HCO+(2−1) and HCN(2−1) integrated intensities and the line widths (FWHM) of the lines. The LMC pointings appear as blue triangles and the SMC pointings as red triangles. The light and dark blue squares indicate the individual detections from the LMC spectral maps (18″ pixels) detected at a 3 and 5-σ level, respectively. Panel a: the dashed black line indicates the best linear fit to all the data. Panels a and c: the dotted gray line is the 1:1 relation.
Current usage metrics show cumulative count of Article Views (full-text article views including HTML views, PDF and ePub downloads, according to the available data) and Abstracts Views on Vision4Press platform.
Data correspond to usage on the plateform after 2015. The current usage metrics is available 48-96 hours after online publication and is updated daily on week days.
Initial download of the metrics may take a while.