Open Access
Fig. 6.
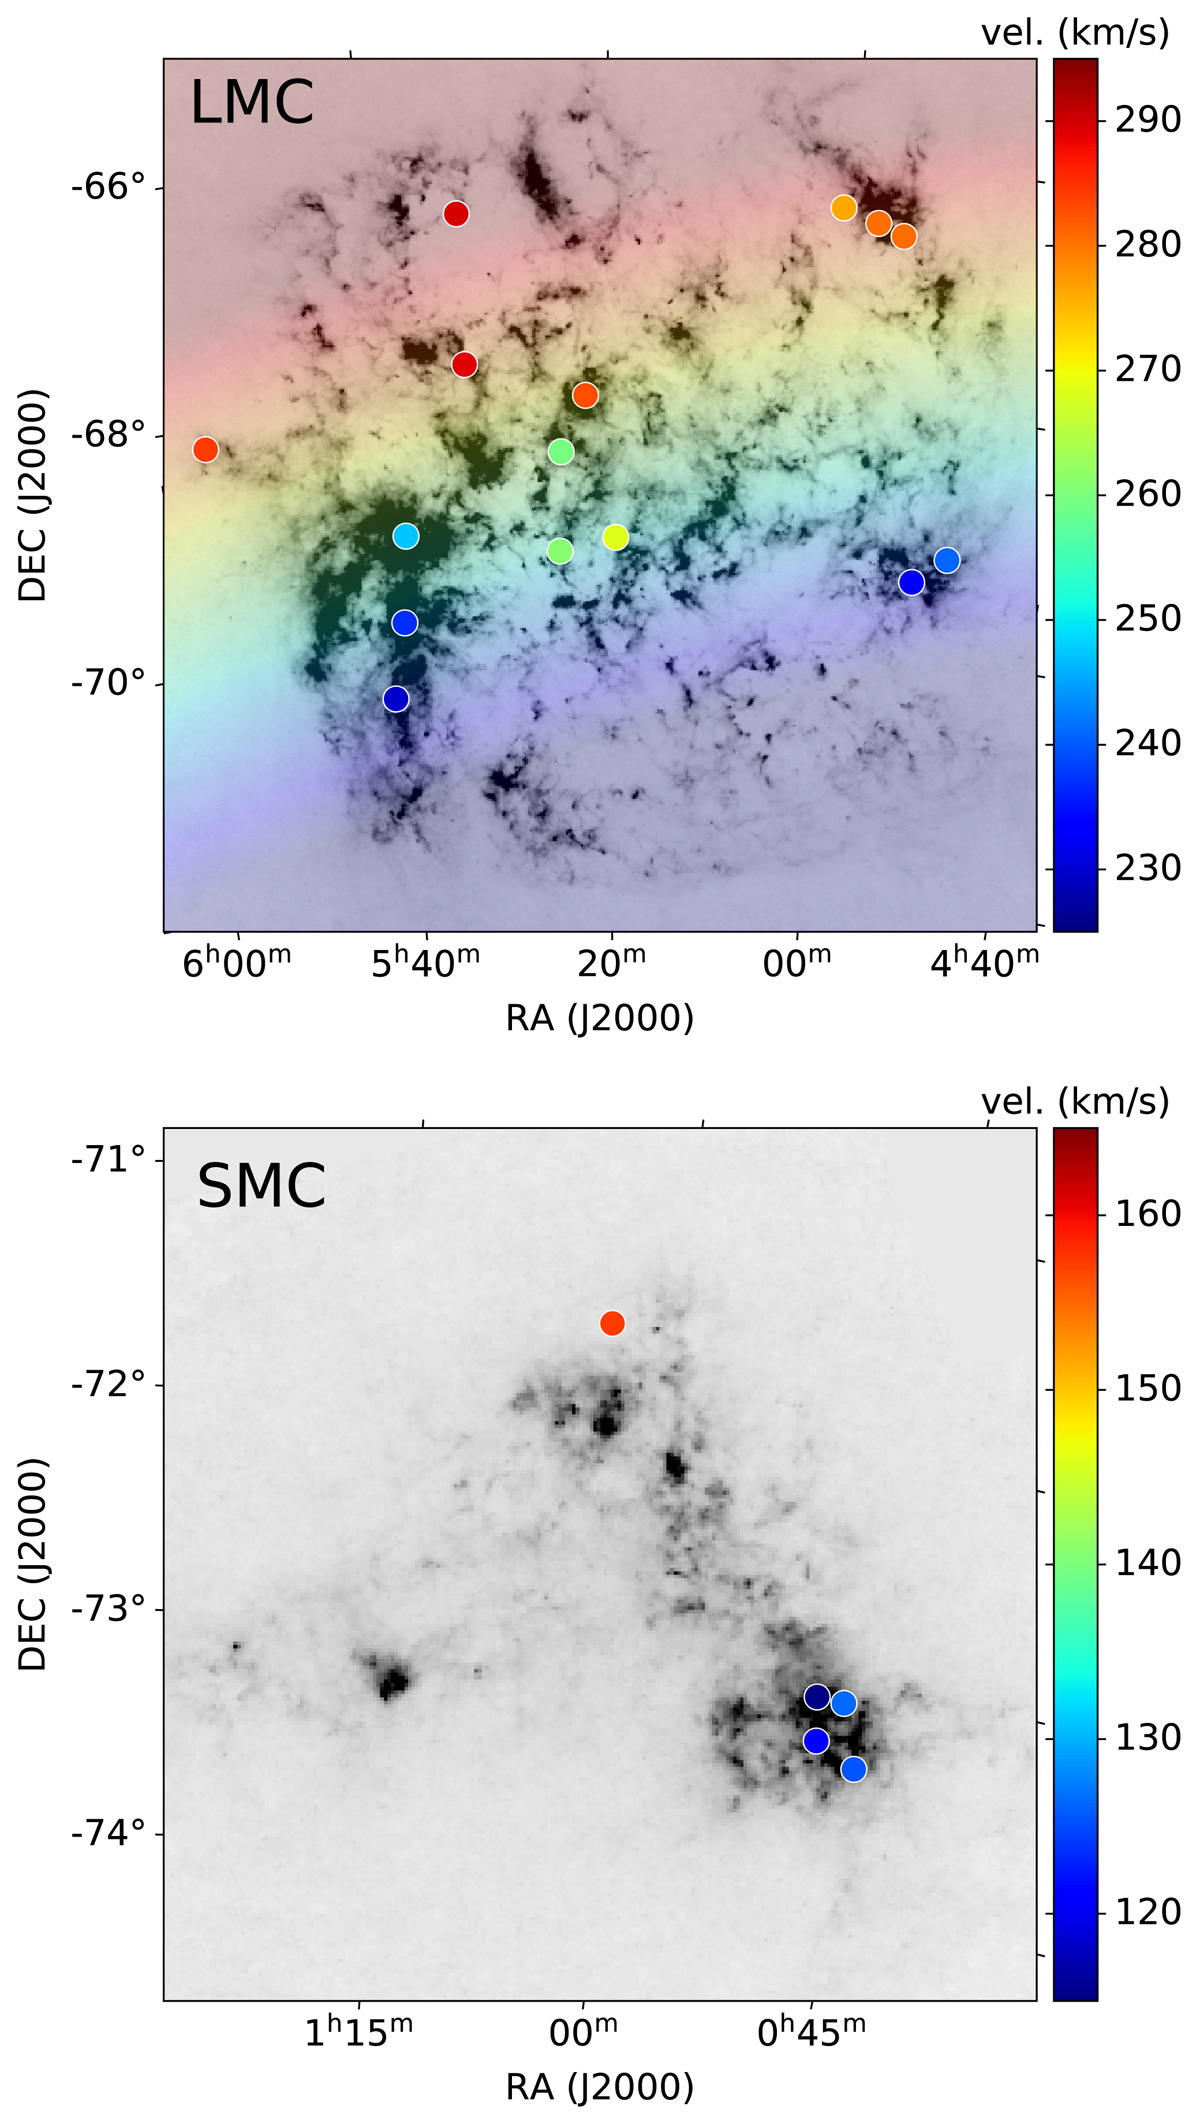
LMC and SMC LOS velocity fields as traced by the HCO+ line. The pointings are represented by circles coded by their associated velocity (in units of km s−1) according to the provided color scales. For the LMC, we derive a velocity gradient of 0.31 ± 0.1 km s−1 kpc−1 (P.A. = 5°; overlaid in rainbow).
Current usage metrics show cumulative count of Article Views (full-text article views including HTML views, PDF and ePub downloads, according to the available data) and Abstracts Views on Vision4Press platform.
Data correspond to usage on the plateform after 2015. The current usage metrics is available 48-96 hours after online publication and is updated daily on week days.
Initial download of the metrics may take a while.