Fig. 2.
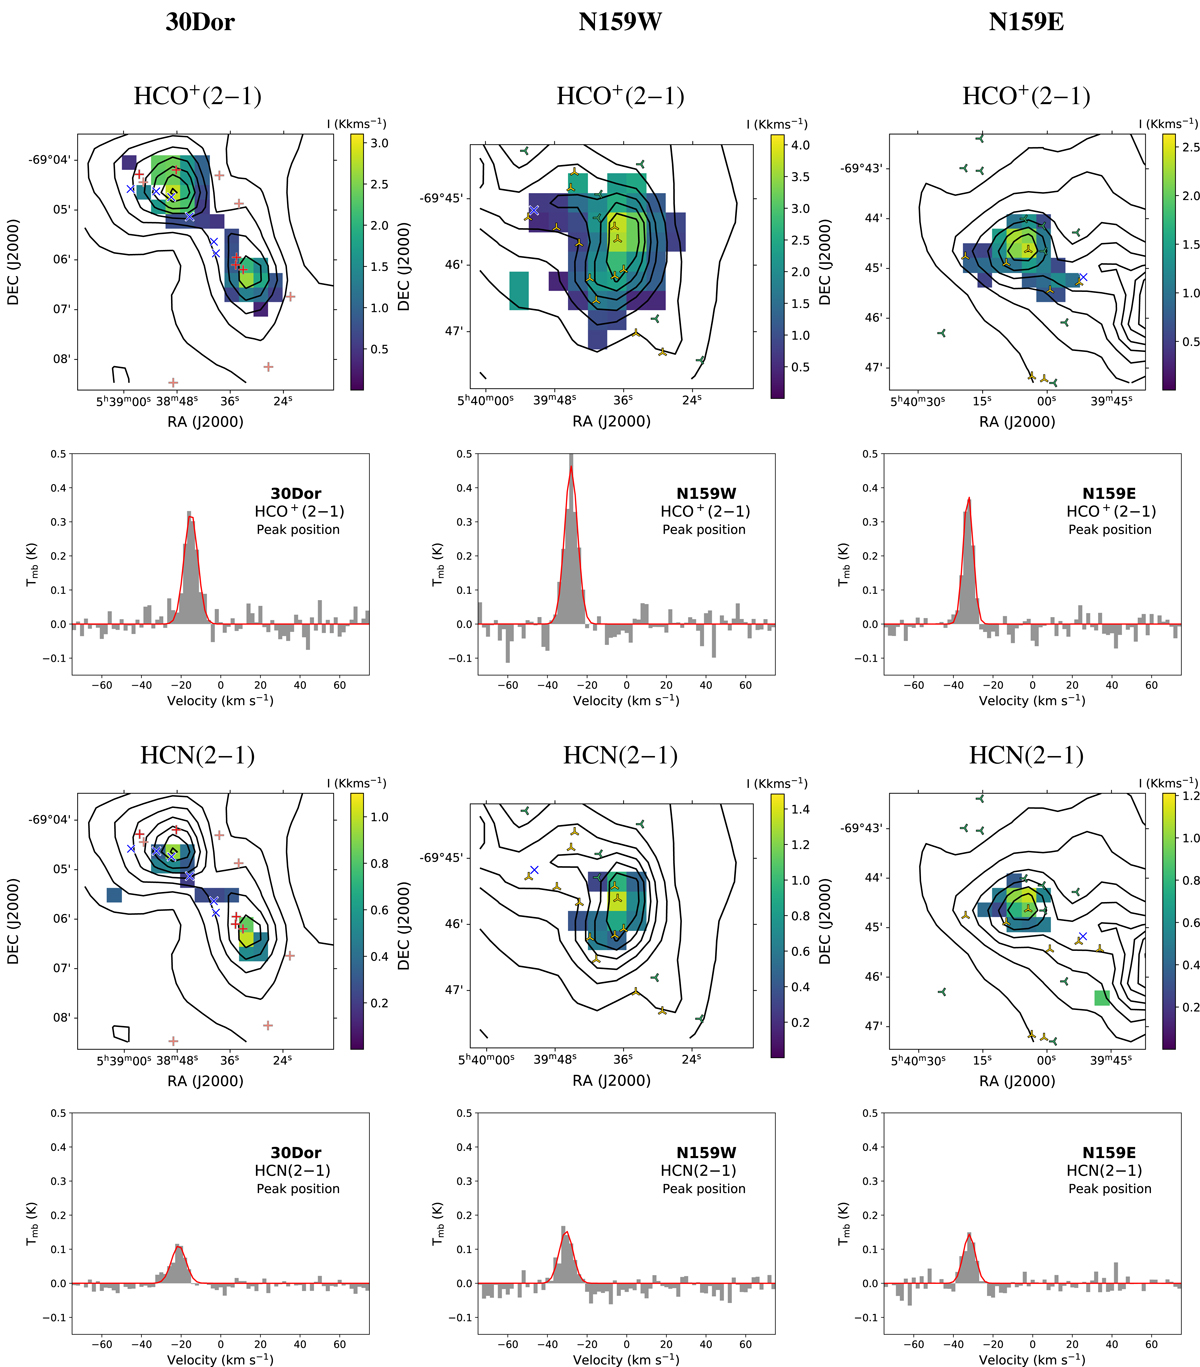
From top to bottom: HCO+(2−1) and HCN(2−1) integrated intensity maps of 30Dor, N159W, and N159E, from left to right, respectively (3-σ detections). The cold dust emission as traced by Herschel PACS 160 μm is overlaid as contours. For each map, we show the corresponding spectrum at peak position (2 km s−1 spectral resolution) and overlay in red the Gaussian fit performed to derive the peak position line characteristics of Table B.1. The bottom x-axis is expressed in velocity with respect to the systemic velocity (v = 0 corresponding to 262.2 km s−1). Candidate YSOs retrieved from different catalogs are overlaid: purple down-tridents from Whitney et al. (2008), blue crosses from Seale et al. (2012), red and salmon plus symbols from Gruendl & Chu (2009), yellow up-tridents from Chen et al. (2009, 2010), and green left-tridents from Carlson et al. (2012).
Current usage metrics show cumulative count of Article Views (full-text article views including HTML views, PDF and ePub downloads, according to the available data) and Abstracts Views on Vision4Press platform.
Data correspond to usage on the plateform after 2015. The current usage metrics is available 48-96 hours after online publication and is updated daily on week days.
Initial download of the metrics may take a while.