Fig. 10.
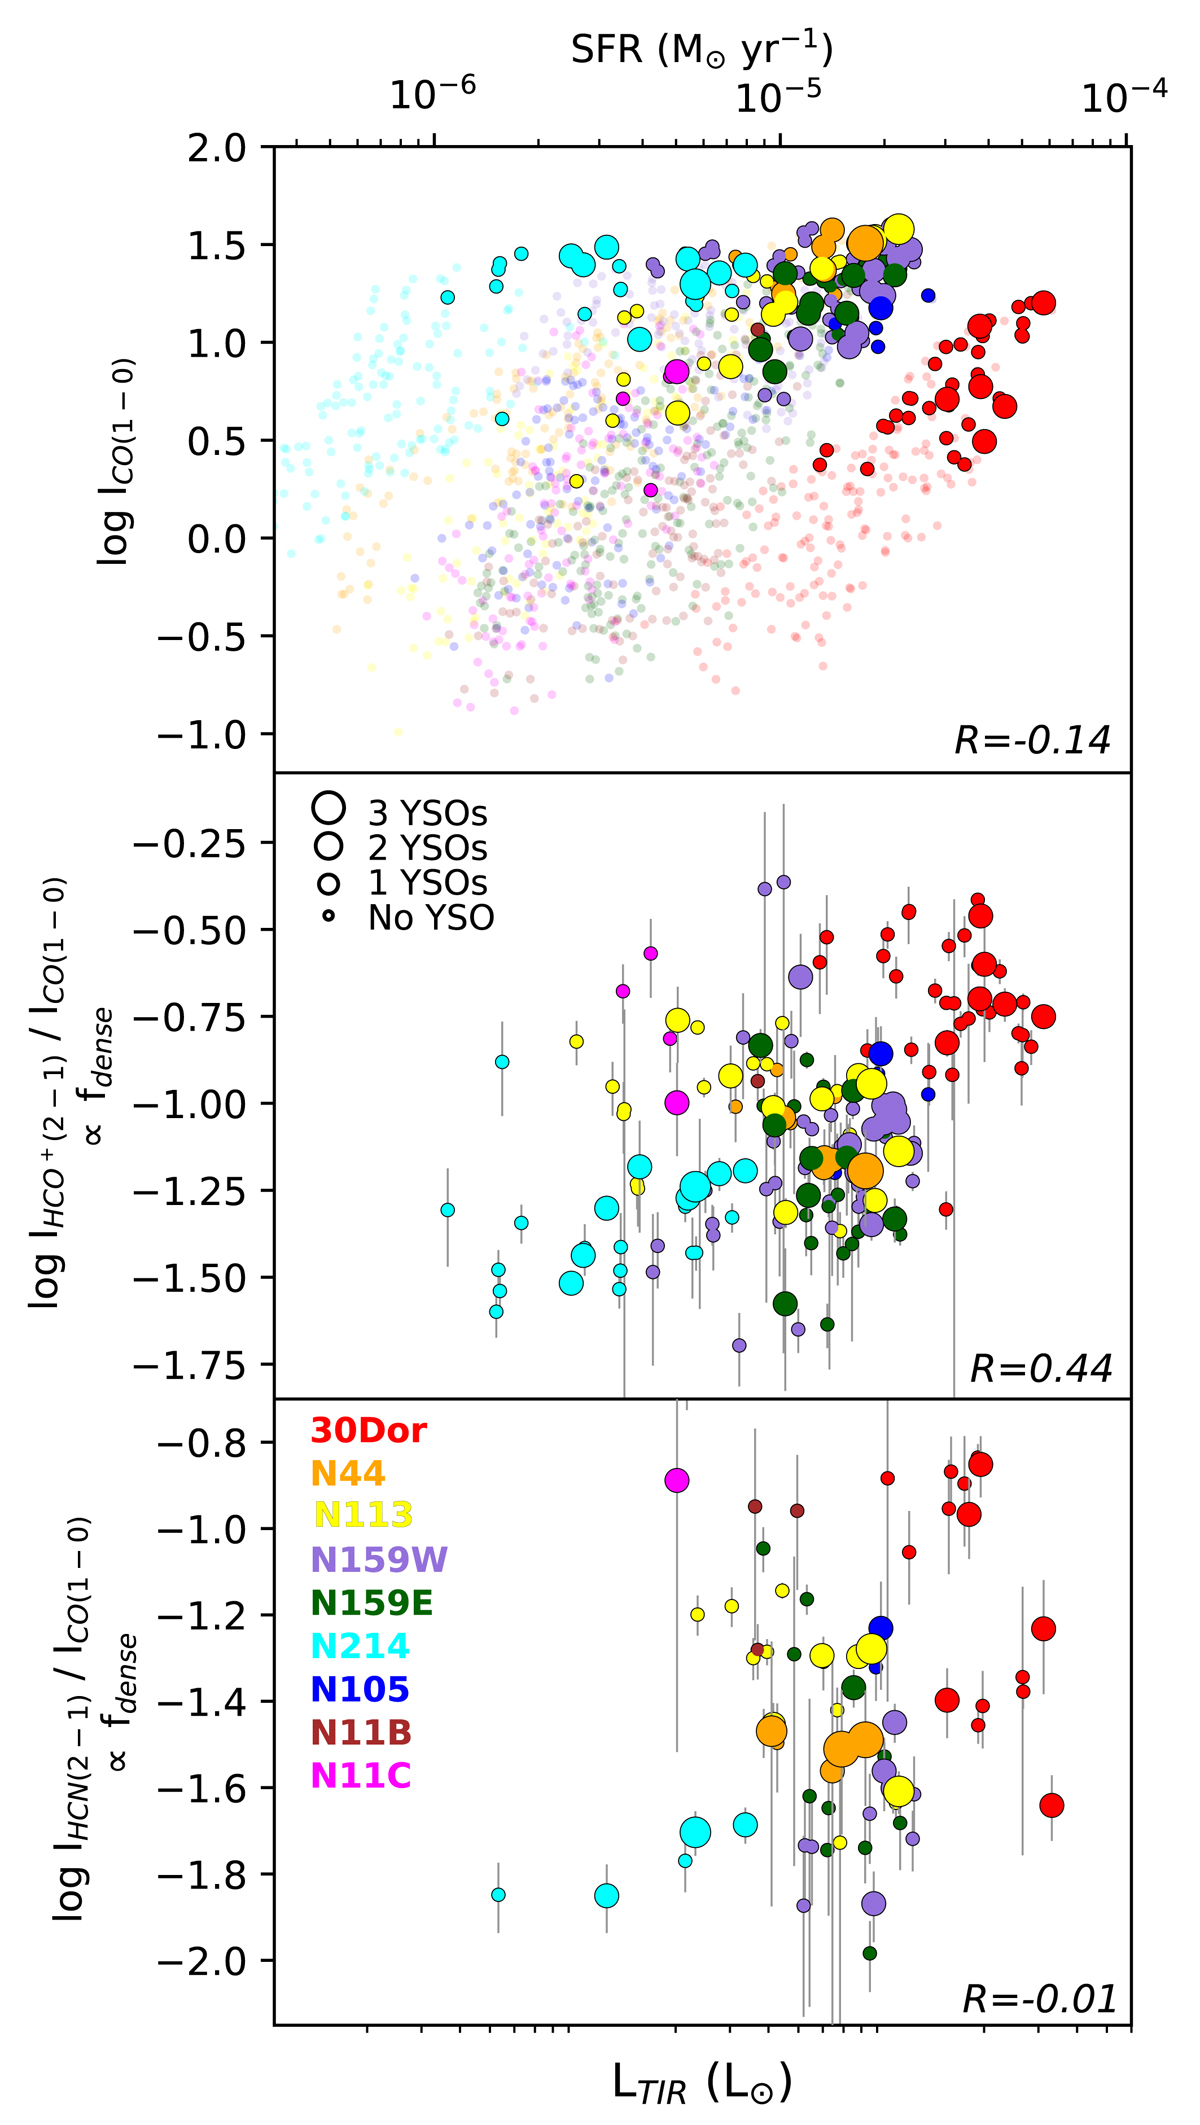
Top: relation between the CO(1−0) intensity (in K km s−1) and the local LTIR for LOSs where HCO+(2−1) has been detected with DeGaS-MC (and associated Pearson correlation coefficient R). The shaded points complement the relation for all LOSs where CO(1−0) has been detected. The colors separate the various star-forming regions and the increasing size of the symbols indicates an increase in the YSO number (0, 1, 2 or 3) for each LOS. The corresponding local SFRs are indicated on the upper x-axis. Middle and bottom: variation of the HCO+(2−1)/CO(1−0) (middle), a proxy for the dense gas fraction, and of the HCN(2−1)/CO(1−0) (bottom) ratio (with intensities in K km s−1) as a function of the local LTIR.
Current usage metrics show cumulative count of Article Views (full-text article views including HTML views, PDF and ePub downloads, according to the available data) and Abstracts Views on Vision4Press platform.
Data correspond to usage on the plateform after 2015. The current usage metrics is available 48-96 hours after online publication and is updated daily on week days.
Initial download of the metrics may take a while.