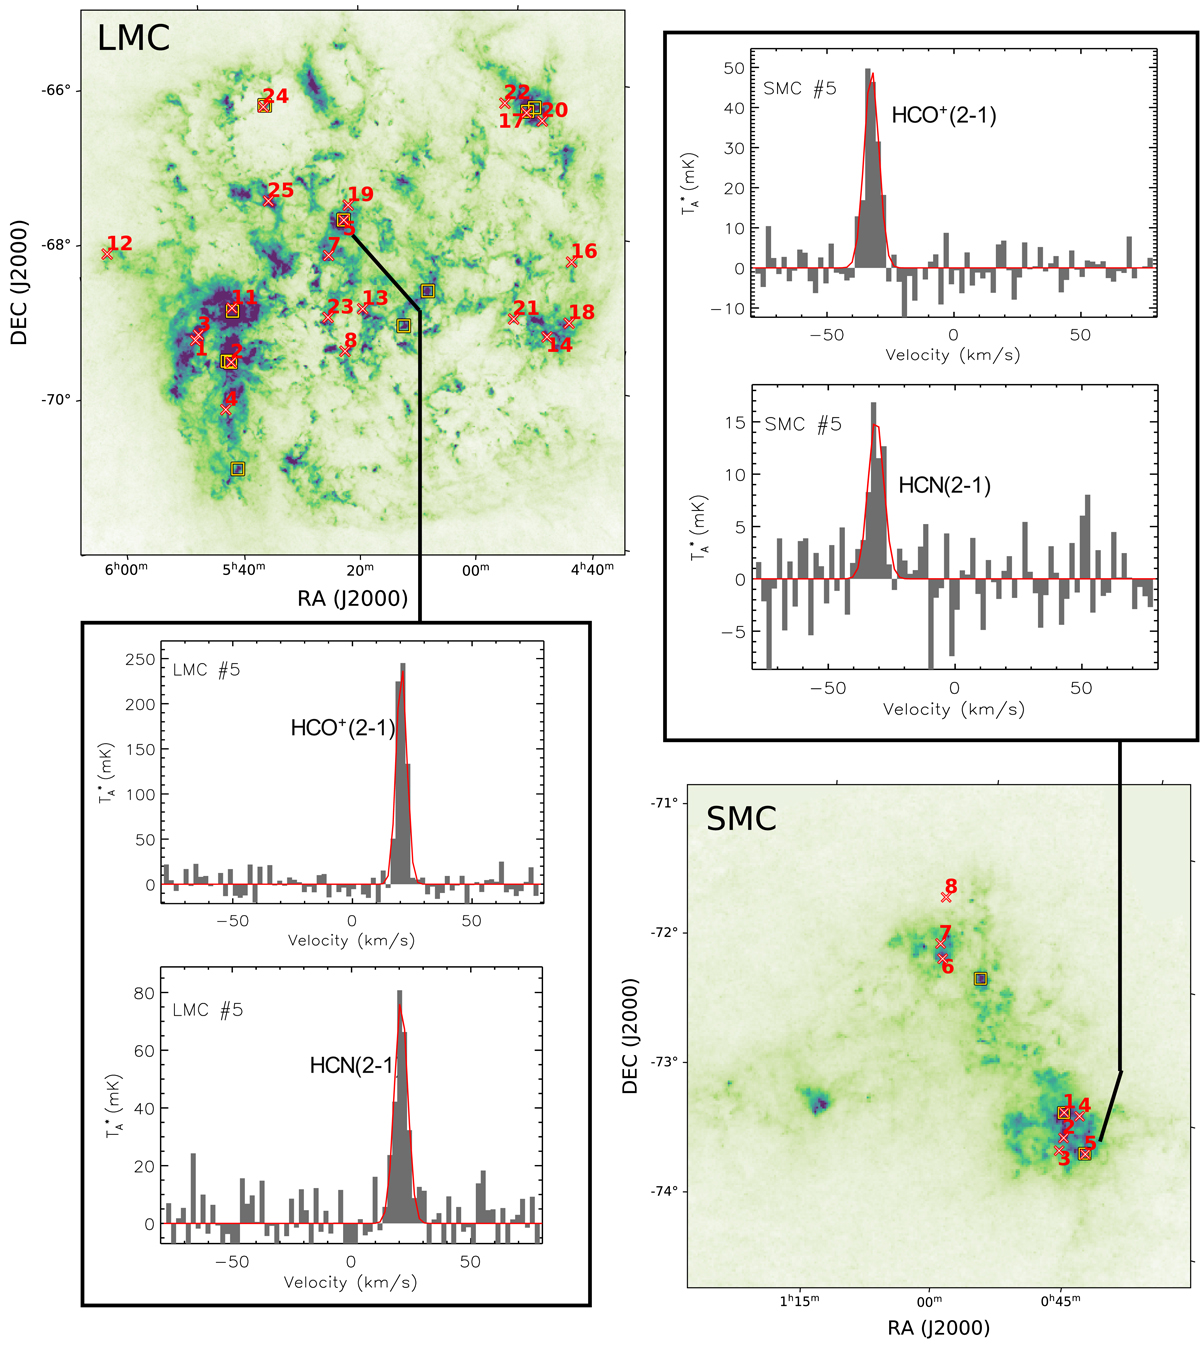
Fig. 1.

DeGaS-MC pointing campaign: the positions of our pointings are indicated by the red crosses overlaid on the LMC and the SMC Herschel 500 μm observations (FWHM = 36″). An example of the HCO+(2−1) and HCN(2−1) spectra obtained towards regions LMC #5 and SMC #5 are shown (2 km s−1 spectral resolution). The x-axis is expressed in velocity with respect to the systemic velocities (v = 0 corresponding to 262.2 km s−1 for the LMC and 158 km s−1 for the SMC). The catalogue of HCO+(2−1) and HCN(2−1) spectra is shown in Figs. A.1 and A.2. The yellow squares indicate the position of the sources targeted during the follow-up mapping campaign (see Sect. 2.2). Please note that the areas mapped are ∼4′ × 4′, i.e., smaller than these squares.
Current usage metrics show cumulative count of Article Views (full-text article views including HTML views, PDF and ePub downloads, according to the available data) and Abstracts Views on Vision4Press platform.
Data correspond to usage on the plateform after 2015. The current usage metrics is available 48-96 hours after online publication and is updated daily on week days.
Initial download of the metrics may take a while.


