Fig. 9.
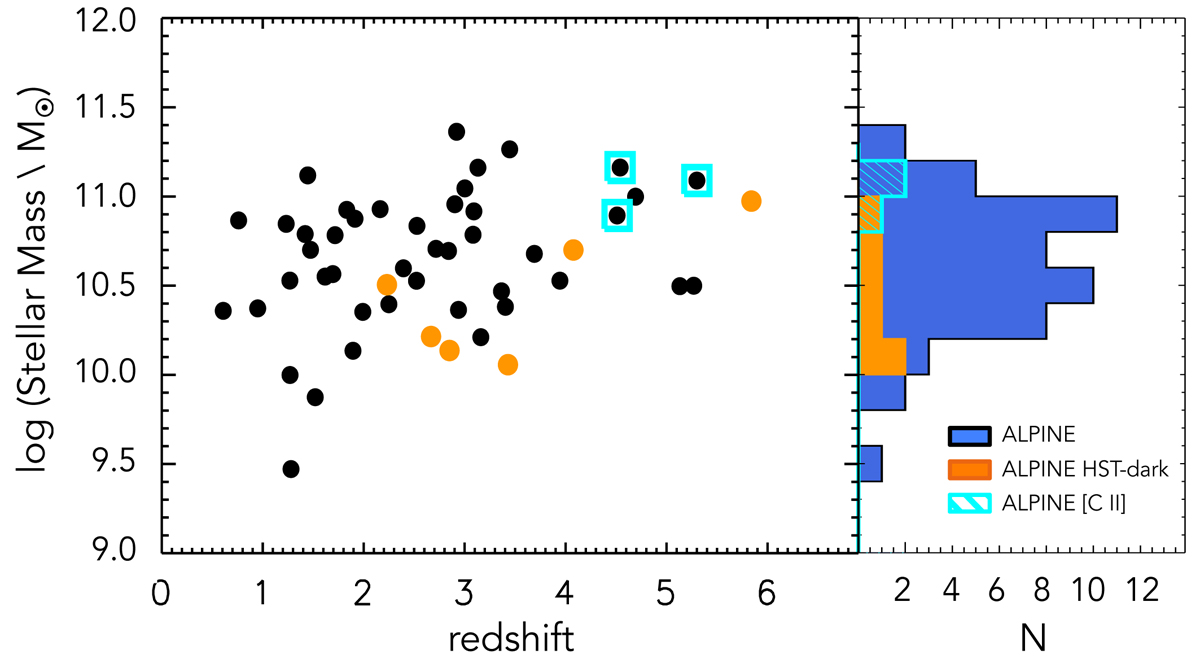
Stellar mass versus redshift (left) and stellar mass histogram (right) for ALPINE continuum non-target detections. The black filled circles and blue filled histogram show the distribution of the whole sample, while the orange circles and histogram show the locus occupied by the HST+near-IR dark sources. The cyan open squares and dashed-histogram show, for comparison, the locus of the sources identified with [C II] emitters at the same redshift of the ALPINE targets (we note that the two without photometric counterparts are missing, since for them a mass estimate was impossible).
Current usage metrics show cumulative count of Article Views (full-text article views including HTML views, PDF and ePub downloads, according to the available data) and Abstracts Views on Vision4Press platform.
Data correspond to usage on the plateform after 2015. The current usage metrics is available 48-96 hours after online publication and is updated daily on week days.
Initial download of the metrics may take a while.