Fig. 8.
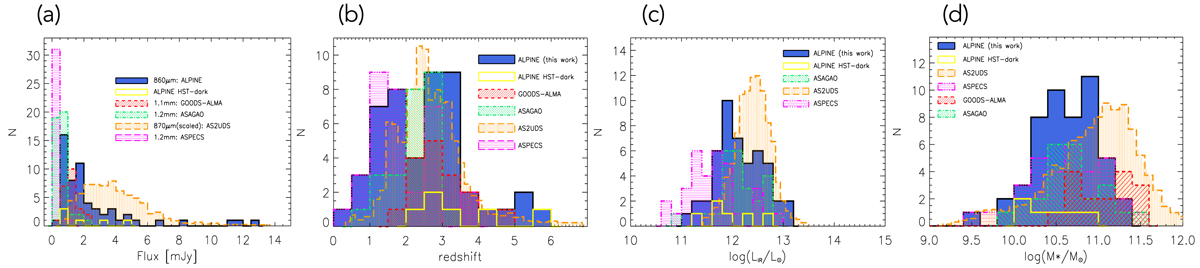
Distribution of 860 μm flux density of all 56 ALMA continuum serendipitous detections (a), redshift (b), total IR luminosity (c), and stellar mass distribution (d) of the 47 sources with measured redshift that were not associated with the ALPINE targets (i.e. blue histogram in Fig. 7). The four distributions are compared with previous results from the literature, either from blind ALMA surveys like GOODS-ALMA, ASAGAO, and ASPECS (Franco et al. 2018; Hatsukade et al. 2018; Aravena et al. 2020, respectively), or from ALMA surveys of pre-selected SMGs such as the AS2UDS (i.e. Dudzevičiūtė et al. 2020; the AS2UDS distributions have been rescaled, i.e. divided by 100, for comparison purposes). The ASAGAO masses are from Table 1 of Yamaguchi et al. (2020): the plotted values are the ZFOURGE ones (those derived with MAGPHYS are significantly higher). The different colours and shadings of the histograms associated with each survey are shown in the legend. The yellow histograms show the distribution of the six HST+near-IR dark galaxies. We note that the flux densities reported in panel a from different surveys are at different wavelengths, therefore not directly comparable, meaning the 860/870 μm fluxes would correspond to about a factor of ∼2 fainter values if translated to 1.1/1.2 mm.
Current usage metrics show cumulative count of Article Views (full-text article views including HTML views, PDF and ePub downloads, according to the available data) and Abstracts Views on Vision4Press platform.
Data correspond to usage on the plateform after 2015. The current usage metrics is available 48-96 hours after online publication and is updated daily on week days.
Initial download of the metrics may take a while.