Fig. 7.
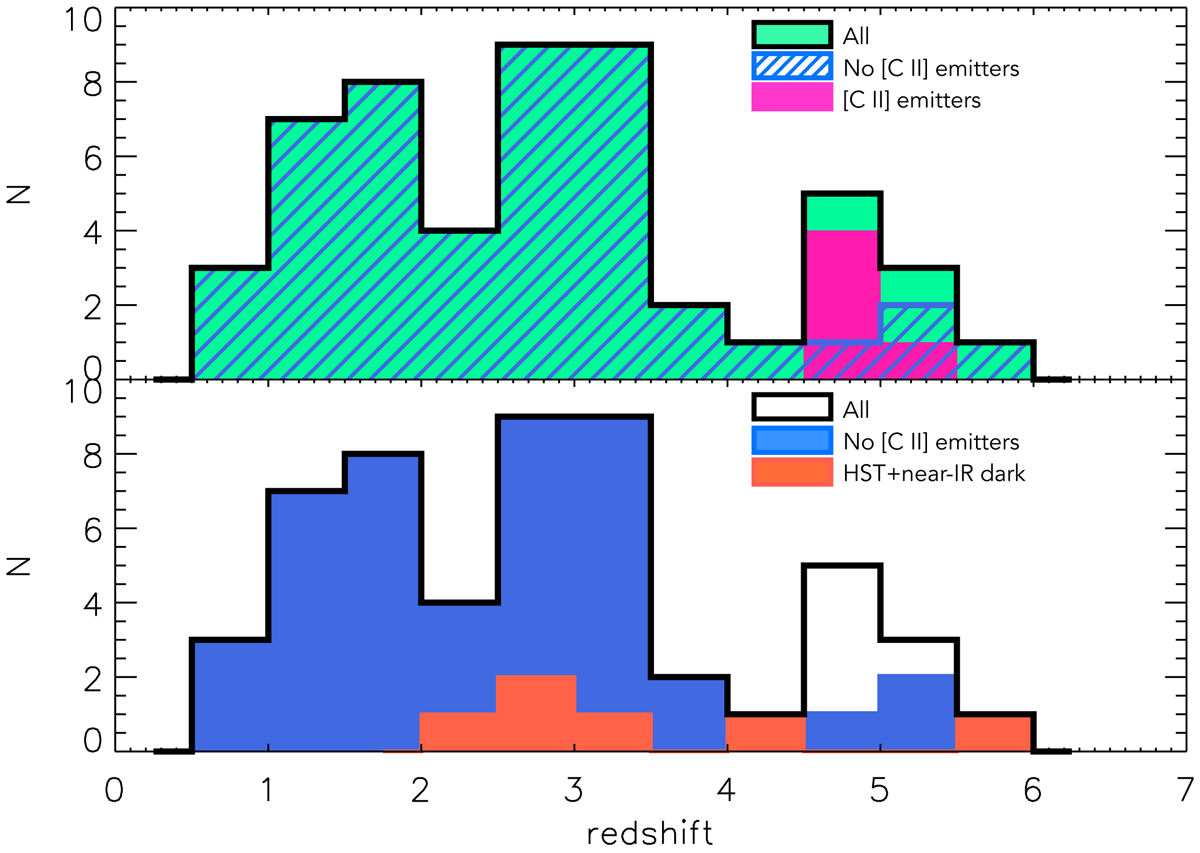
Redshift distribution of ALPINE non-target sources detected in continuum with an identification (green-filled black histogram in the top panel, empty in the bottom panel). Top panel: the deep-pink histogram shows the five sources detected in [C II] at the same redshift of the ALPINE central targets, while the blue-dashed histogram shows the redshifts of the 47 sources considered for the unbiased LF calculation (i.e. excluding the five [C II] emitters). Bottom panel: the latter distribution is shown in blue, while the best fit photometric redshifts of the six HST+near-IR dark galaxies are shown as a red and orange-filled histogram.
Current usage metrics show cumulative count of Article Views (full-text article views including HTML views, PDF and ePub downloads, according to the available data) and Abstracts Views on Vision4Press platform.
Data correspond to usage on the plateform after 2015. The current usage metrics is available 48-96 hours after online publication and is updated daily on week days.
Initial download of the metrics may take a while.