Fig. 5.
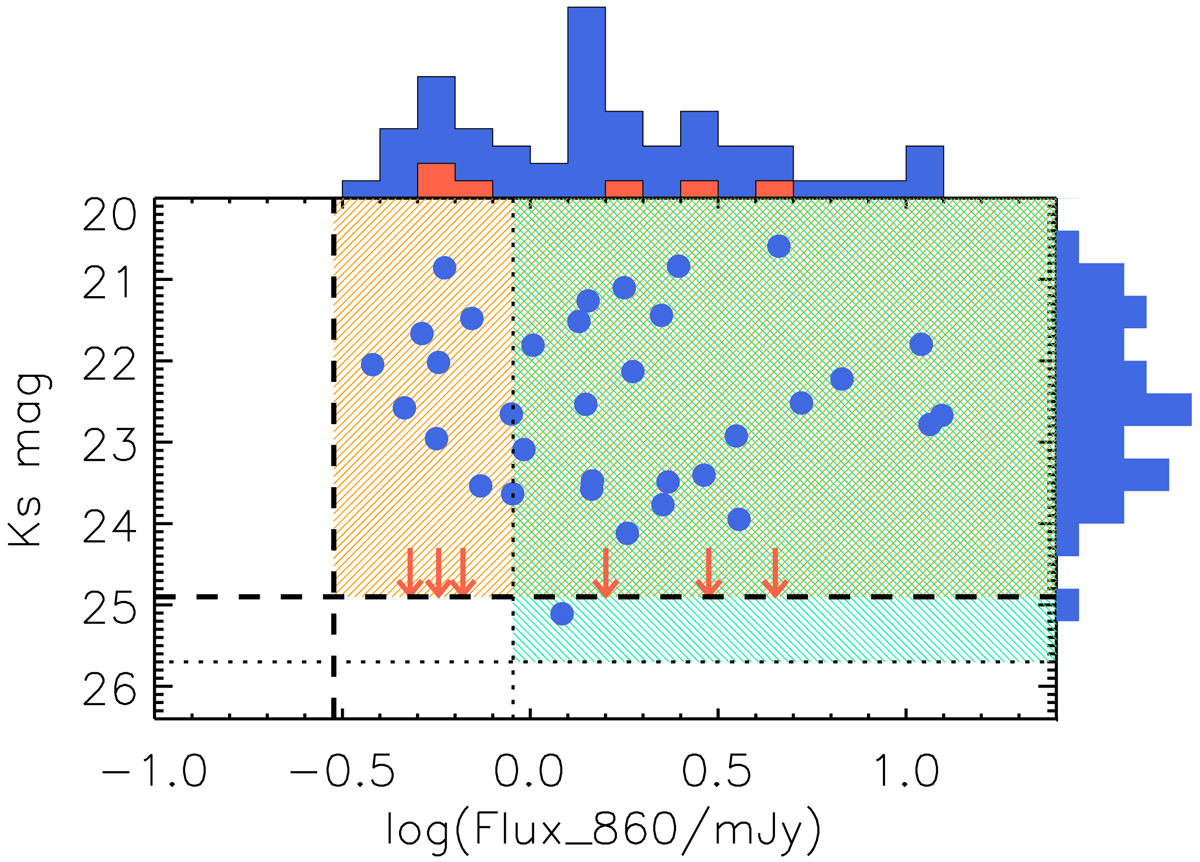
Distribution of observed Ks-band magnitude and 860 μm ALMA fluxes of ALPINE serendipitous continuum sources with a Ks counterpart. The horizontal dashed line shows the UltraVISTA Ks-band 5σ limit of 24.9, while the vertical one shows the minimum 860 μm (5σ) flux density reached by the ALMA sample (the orange coloured area shows the region covered by our data). For comparison, the dotted lines (green filled area) indicate the Ks magnitude and 870 μm flux limits of the AS2UDS sample of SMGs reported by Dudzevičiūtė et al. (2020). The downward-pointing arrows shown at the Ks-band limit are the six sources detected only at mid-IR wavelengths. The histograms show the Ks-band magnitude distribution on the right axis, and the 860 μm flux density distribution is on the top axis of the plot (orange histogram showing the fluxes of the mid-IR detected sources).
Current usage metrics show cumulative count of Article Views (full-text article views including HTML views, PDF and ePub downloads, according to the available data) and Abstracts Views on Vision4Press platform.
Data correspond to usage on the plateform after 2015. The current usage metrics is available 48-96 hours after online publication and is updated daily on week days.
Initial download of the metrics may take a while.