Fig. 17.
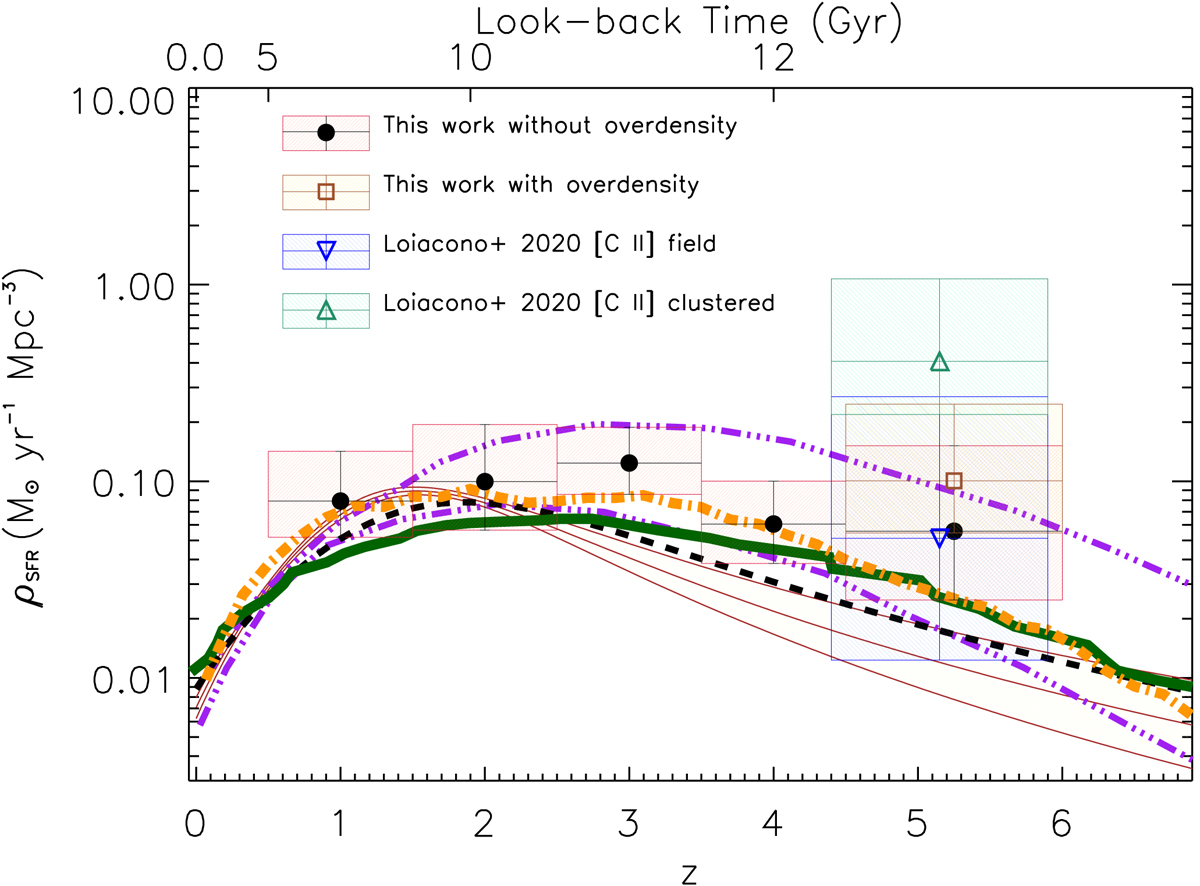
Comparison between SFRD obtained by excluding the two [C II] emitters with optical/near-IR counterparts (red boxes and black circles, same as in Fig. 16) and that estimated by integrating the best fit curve to the 4.5 < z < 6 LF obtained from all the continuum detections, including the two [C II] emitters (yellow boxes and brown open square). For comparison, we also report the results obtained by Loiacono et al. (2020) by integrating the [C II] LF of the serendipitous line emitters for field (i.e. lines separated by that of the ALPINE targets by > 2000 km s−1: blue box and open up-side down triangle) and clustered sources (i.e. lines falling in the same spectral window of the ALPINE targets: green box and open triangle). The models by Madau & Dickinson (2014), Béthermin et al. (2017), and Pillepich et al. (2018) are also reported as black dashed, orange dot-dashed, and dark green solid curves, respectively. In addition, we plot the predictions obtained by modelling the CIB of Maniyar et al. (2018), as a light yellow dashed area, and by Lagache (2018) as violet triple-dot-dashed lines (pessimistic and optimistic cases).
Current usage metrics show cumulative count of Article Views (full-text article views including HTML views, PDF and ePub downloads, according to the available data) and Abstracts Views on Vision4Press platform.
Data correspond to usage on the plateform after 2015. The current usage metrics is available 48-96 hours after online publication and is updated daily on week days.
Initial download of the metrics may take a while.