Fig. 16.
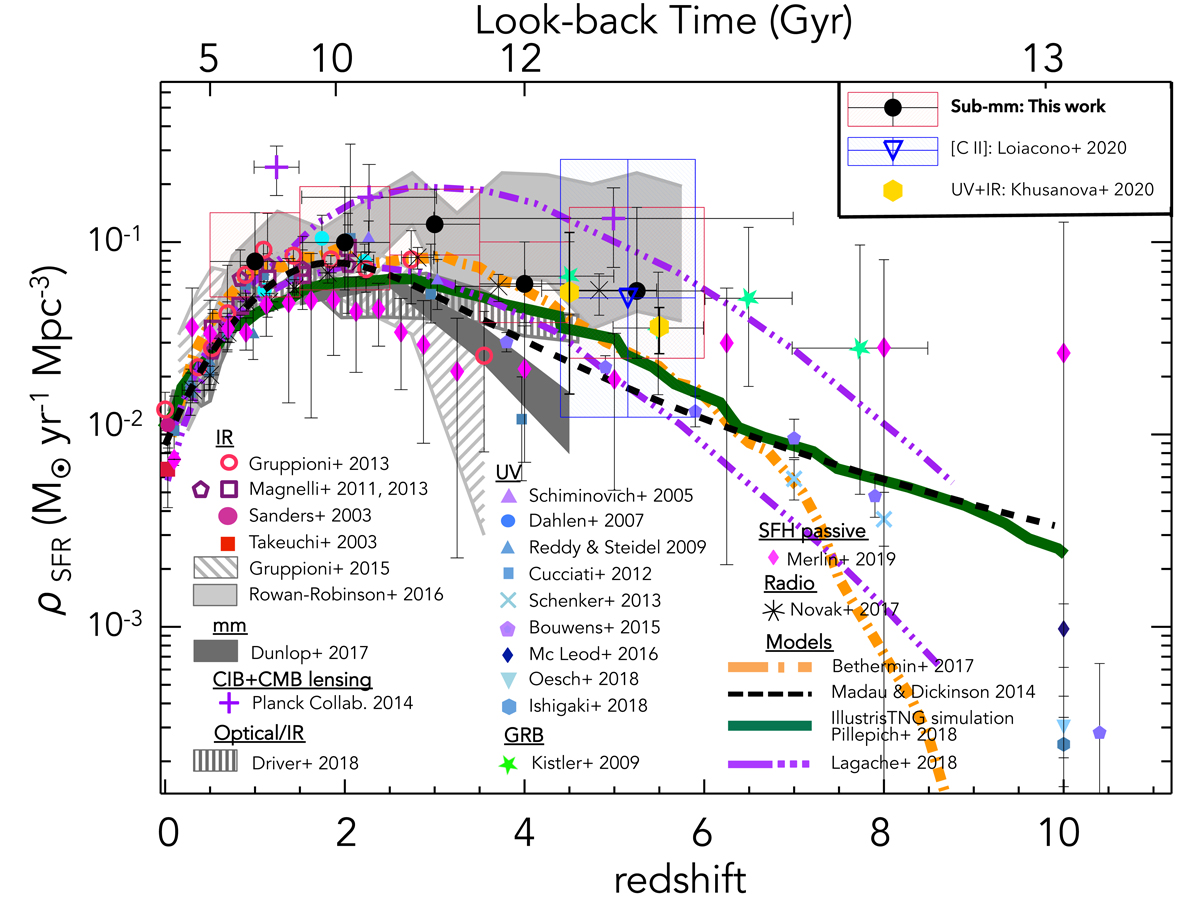
Redshift evolution of co-moving star formation rate density (ρSFR), obtained by integrating the modified Schechter function that best reproduces the ALPINE total IR LF of the continuum non-target detections (excluding the [C II] emitters): black circles. The error bars and the red boxes around our data points show the 1σ uncertainty range derived through the MCMC analysis of the LF. The SFRD estimates from ALPINE (legend in the top-right corner of the plot) are also shown for comparison: the blue box with blue open triangle represents the result obtained from the [C II] LF of the serendipitous line emitters by Loiacono et al. (2020), while the yellow filled hexagons with error bars are the values obtained by Khusanova et al. (2020) from the UV+IR emission of the ALPINE targets. For comparison, estimates from other surveys (UV: Schiminovich et al. 2005; Dahlen et al. 2007; Reddy & Steidel 2009; Cucciati et al. 2012; Schenker et al. 2013; Bouwens et al. 2015; Oesch et al. 2018; optical/near-IR: Driver et al. 2018; Merlin et al. 2019; far-IR: Sanders et al. 2003; Takeuchi et al. 2003; Magnelli et al. 2011, 2013; Gruppioni et al. 2013, 2015; Rowan-Robinson et al. 2016; mm: Dunlop et al. 2017; radio: Novak et al. 2017; gamma-ray bursts: Kistler et al. 2009) are also shown (grey shaded areas and open or filled symbols), as described in the legend at the bottom of the plot. The models by Madau & Dickinson (2014) and Béthermin et al. (2017) are shown as black dashed and orange dot-dashed curves, respectively, while the prediction of the IllustrisTNG simulation (Pillepich et al. 2018) is shown as a dark green solid curve. Also shown are the measurements derived from the cross-correlation between the lensing map of the CMB and the CIB (light blue crosses with error bars, Planck Collaboration XVIII 2014) and the prediction by Lagache (2018) obtained by modelling the CIB (violet triple-dot-dashed curves, showing the pessimistic and optimistic cases).
Current usage metrics show cumulative count of Article Views (full-text article views including HTML views, PDF and ePub downloads, according to the available data) and Abstracts Views on Vision4Press platform.
Data correspond to usage on the plateform after 2015. The current usage metrics is available 48-96 hours after online publication and is updated daily on week days.
Initial download of the metrics may take a while.