Fig. 14.
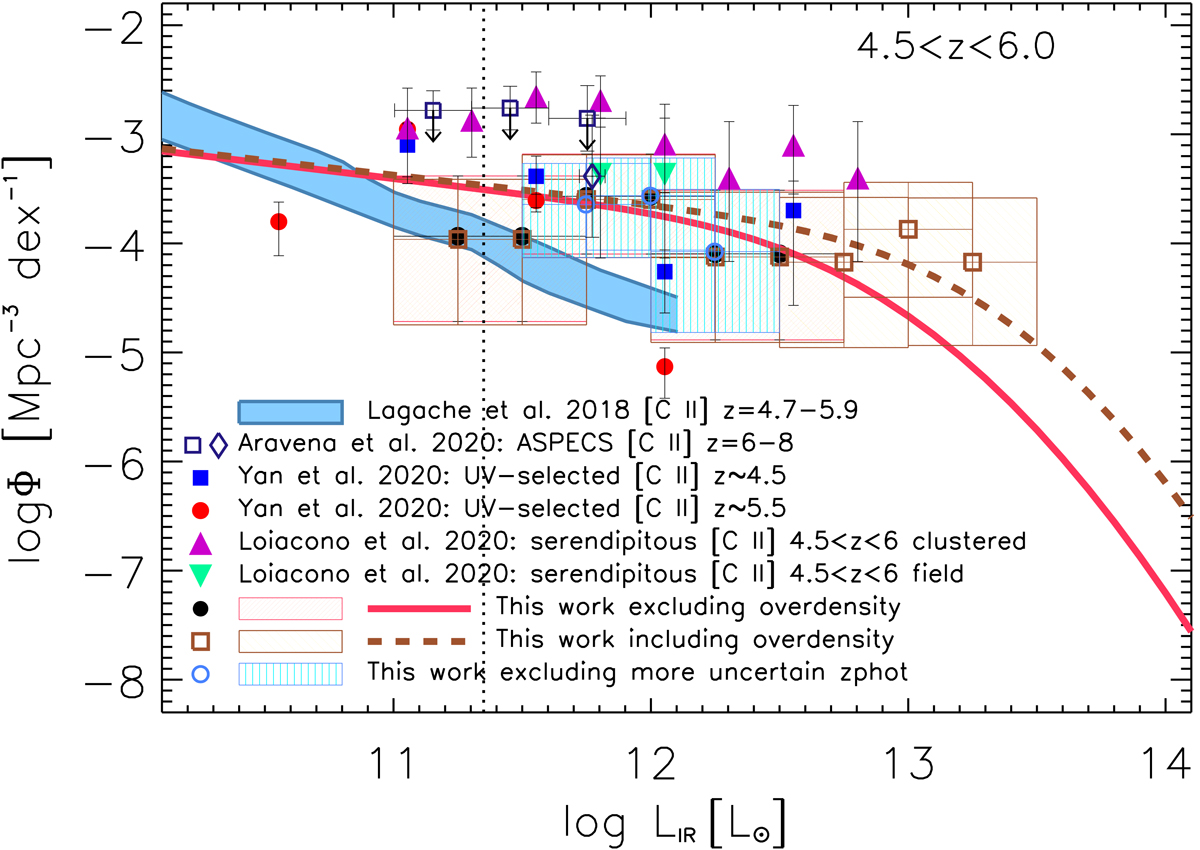
Total IR LF of ALPINE non-target continuum detections in redshift interval 4.5 < z < 6: the results shown in Fig. 13 (red boxes and black filled circles, red solid curve) – obtained by excluding the sources with spectroscopic redshift equal to that of the ALPINE target at the centre of the pointing (i.e. two sources with optical/near-IR identification) – are compared to those obtained by also including these objects (yellow boxes and brown open squares). The brown dashed line is the MCMC modified Schechter fit to the latter LF derivation. The cyan dashed boxes show the LF recomputed after excluding the source with more uncertain photo-z (the one at z = 5.85). This test was performed to check the robustness of our result at these critical redshifts. The error bars in all the LFs show the 1σ errors obtained by combining the Poissonian errors with those derived with simulations, the latter considering the photometric redshift uncertainties. The vertical dotted line shows the ALPINE continuum survey completeness limit in this redshift interval. For comparison, we report the ALPINE [C II]158 μm LFs (converted to total IR LFs as described in the text) at similar redshifts, obtained by Yan et al. (2020) for the UV-selected ALPINE targets detected in [C II] (z ≃ 4.5: blue filled squares, z ≃ 5.5: red filled circles), and by Loiacono et al. (2020) for the serendipitous [C II] detections at 4.5 < z < 6.0 (lines falling in the same spectral window of the targets, that is, “clustered”: violet filled triangles; lines separated by that of the targets by > 2000 km s−1, that is, “field”: green upside-down triangles). The [C II] LF model predictions by Lagache et al. (2018) at z = 4.7–5.9 are reported via the light blue coloured area (z = 4.7 upper boundary, z = 5.9 lower), while the ASPECS derivation of the [C II] LFs at z = 6–8 by Aravena et al. (2020) are shown as dark blue open symbols (squares with downward-pointing arrows show upper limits, and the diamond shows the lower limit assuming that only one source is real).
Current usage metrics show cumulative count of Article Views (full-text article views including HTML views, PDF and ePub downloads, according to the available data) and Abstracts Views on Vision4Press platform.
Data correspond to usage on the plateform after 2015. The current usage metrics is available 48-96 hours after online publication and is updated daily on week days.
Initial download of the metrics may take a while.