Fig. 13.
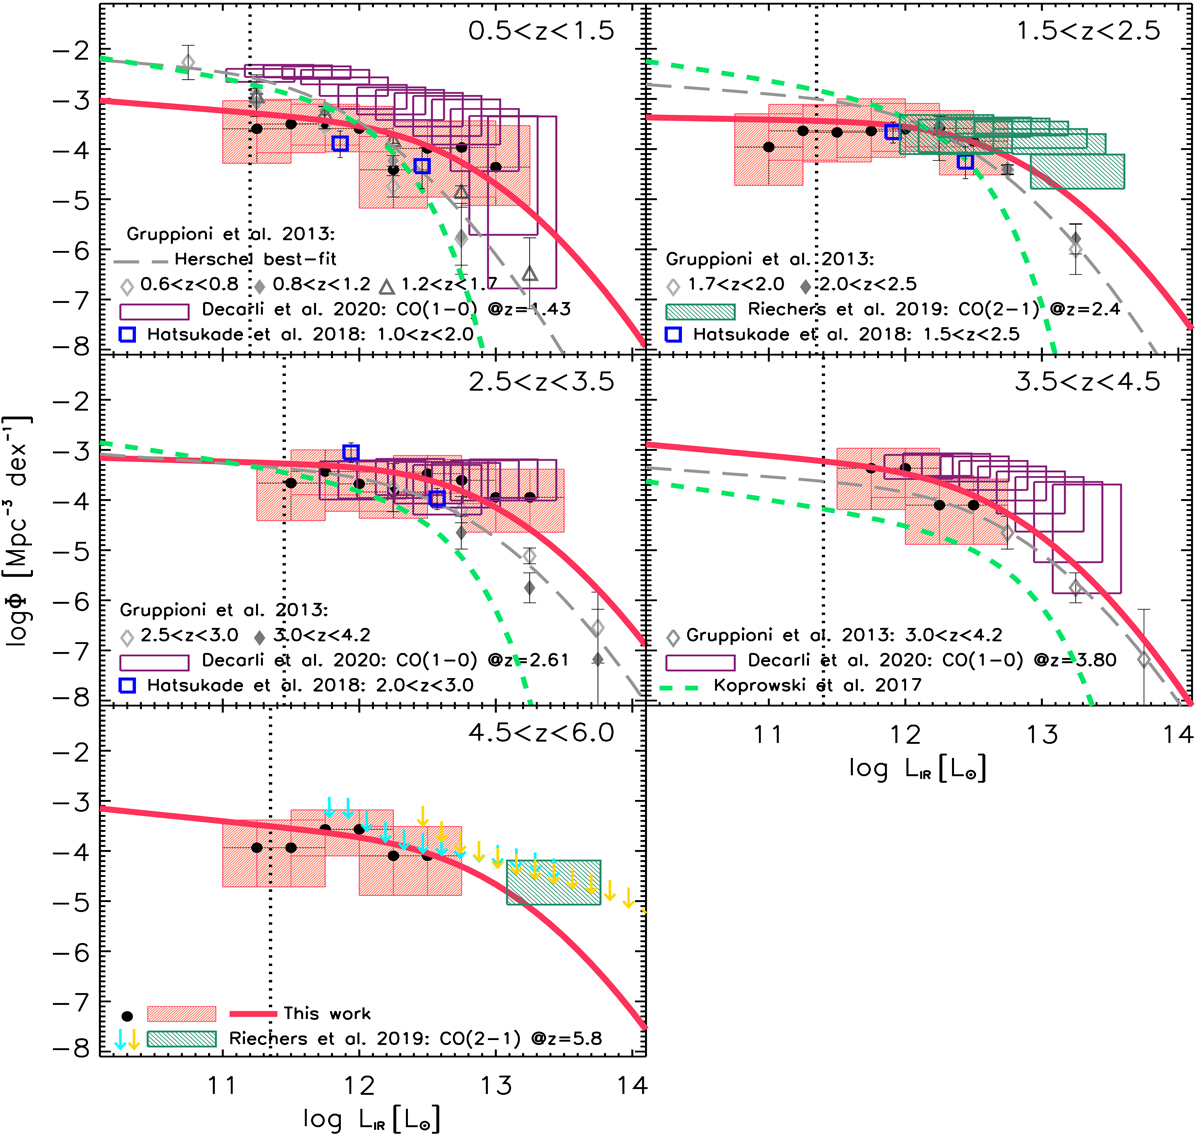
Total IR LF of ALPINE non-target continuum detections (red boxes and black filled circles). The luminosity bins have a width of 0.5 dex in LIR, and step through the luminosity range in steps of 0.25 dex. For this reason, the individual bins are not statistically independent. The red filled boxes and error bars indicate the 1σ errors derived through simulations (taking into account the photometric redshift uncertainties). The red solid curve is the best fit modified Schechter function derived through the MCMC analysis (see Sect. 4.3.3), while the grey long-dashed curve represents the best fit (modified Schechter function) to the Herschel PEP+HerMES total IR LF by Gruppioni et al. (2013) (interpolated to the redshift bins considered in this work). The Herschel PEP+HerMES 1/Vmax data and error bars (at slightly different redshift intervals) are plotted as grey symbols. The green short-dashed curves represent the SCUBA-2 S2CLS derivation by Koprowski et al. (2017). The blue open squares show the ALMA ASAGAO LFs by Hatsukade et al. (2018). The dark green dashed boxes and downward-pointing arrows are the COLDz CO(2-1) and CO(1-0) LFs and limits by Riechers et al. (2019) at z = 2.4 and 5.8, respectively, converted to LIR as described in the text. The vertical dotted line shows the ALPINE continuum survey completeness limit in LIR, computed by considering the nominal 860 μm limiting flux of our survey (0.3 mJy; Béthermin et al. 2020) and the template, among those of the library fitting our SEDs, which provided the brightest luminosity at the redshift of the bin.
Current usage metrics show cumulative count of Article Views (full-text article views including HTML views, PDF and ePub downloads, according to the available data) and Abstracts Views on Vision4Press platform.
Data correspond to usage on the plateform after 2015. The current usage metrics is available 48-96 hours after online publication and is updated daily on week days.
Initial download of the metrics may take a while.