Fig. 12.
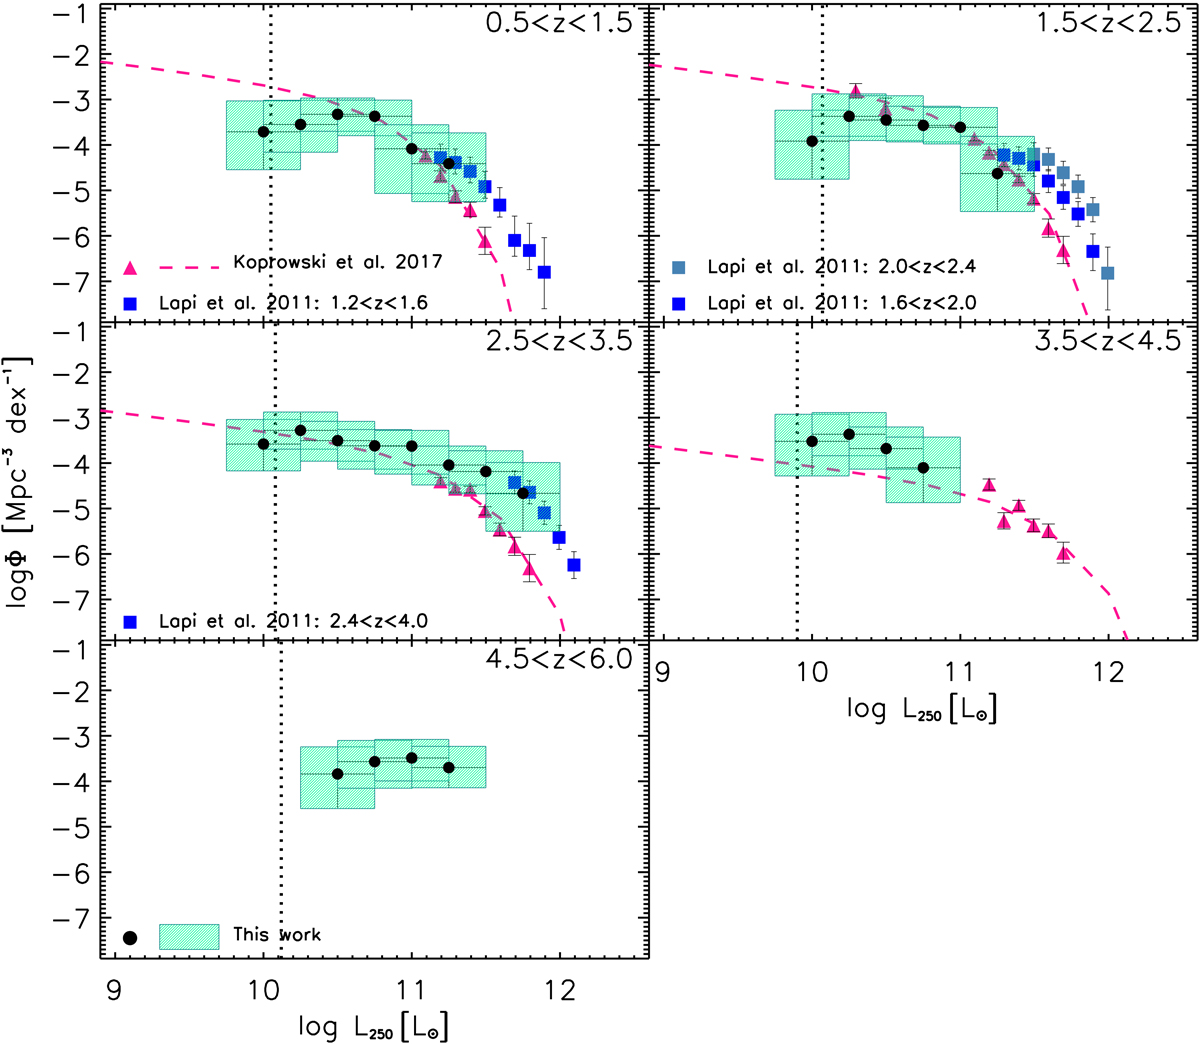
Rest-frame 250 μm LF estimated with 1/Vmax method from ALPINE continuum sample (green boxes and black filled circles). The luminosity bins have a width of 0.5 dex in L250 μm, and step through the luminosity range in stages of 0.25 dex. For this reason, the individual bins are not statistically independent. The error bars in the data points represent the uncertainties obtained from the simulations (as described in Sect. 4.3). The deep-pink triangles and dashed curves are the SCUBA-2 250 μm LFs by Koprowski et al. (2017), while the blue filled squares are the Herschel ATLAS 250 μm LFs by Lapi et al. (2011), the latter being in slightly different redshift intervals. The vertical dotted line shows the completeness limit of our continuum survey, estimated as described in the text by considering the nominal 860 μm limiting flux of 0.3 mJy (Béthermin et al. 2020).
Current usage metrics show cumulative count of Article Views (full-text article views including HTML views, PDF and ePub downloads, according to the available data) and Abstracts Views on Vision4Press platform.
Data correspond to usage on the plateform after 2015. The current usage metrics is available 48-96 hours after online publication and is updated daily on week days.
Initial download of the metrics may take a while.