Free Access
Fig. 9
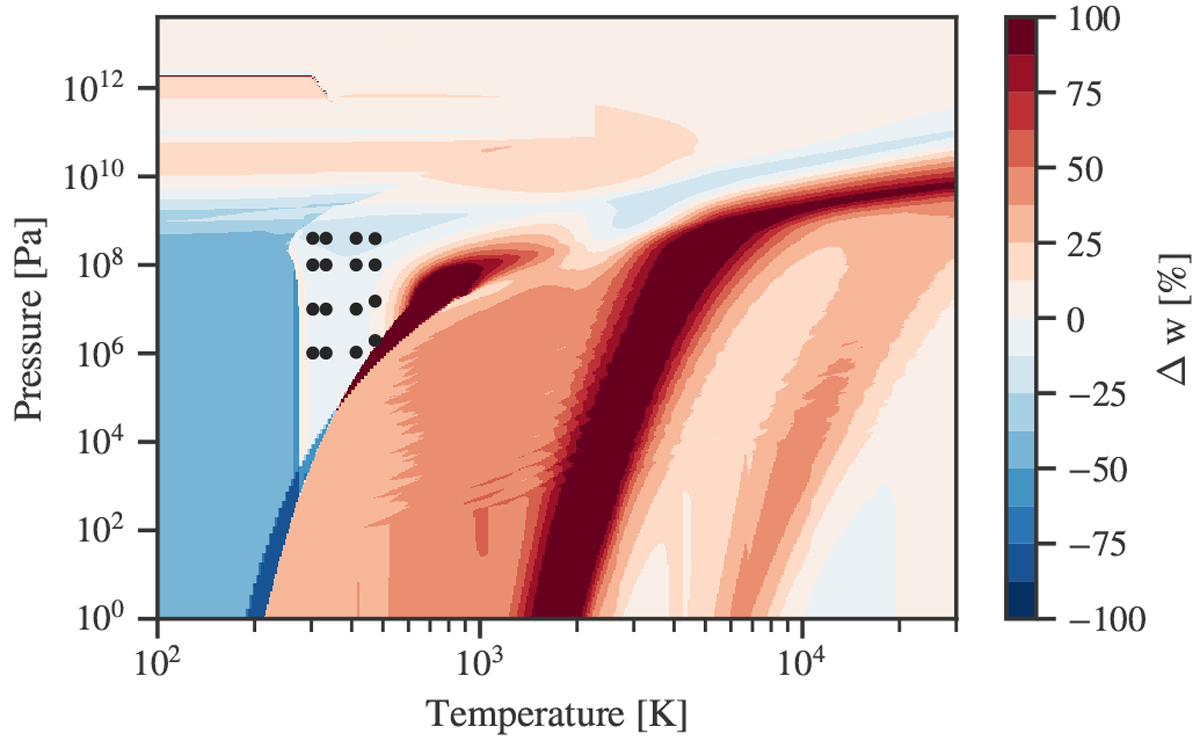
Relative difference between the bulk speed of sound of ANEOS and AQUA as a function of pressure and temperature. The black dots indicate the location of the experimental data of Lin & Trusler (2012) shown in Fig. 10.
Current usage metrics show cumulative count of Article Views (full-text article views including HTML views, PDF and ePub downloads, according to the available data) and Abstracts Views on Vision4Press platform.
Data correspond to usage on the plateform after 2015. The current usage metrics is available 48-96 hours after online publication and is updated daily on week days.
Initial download of the metrics may take a while.