Free Access
Fig. 6
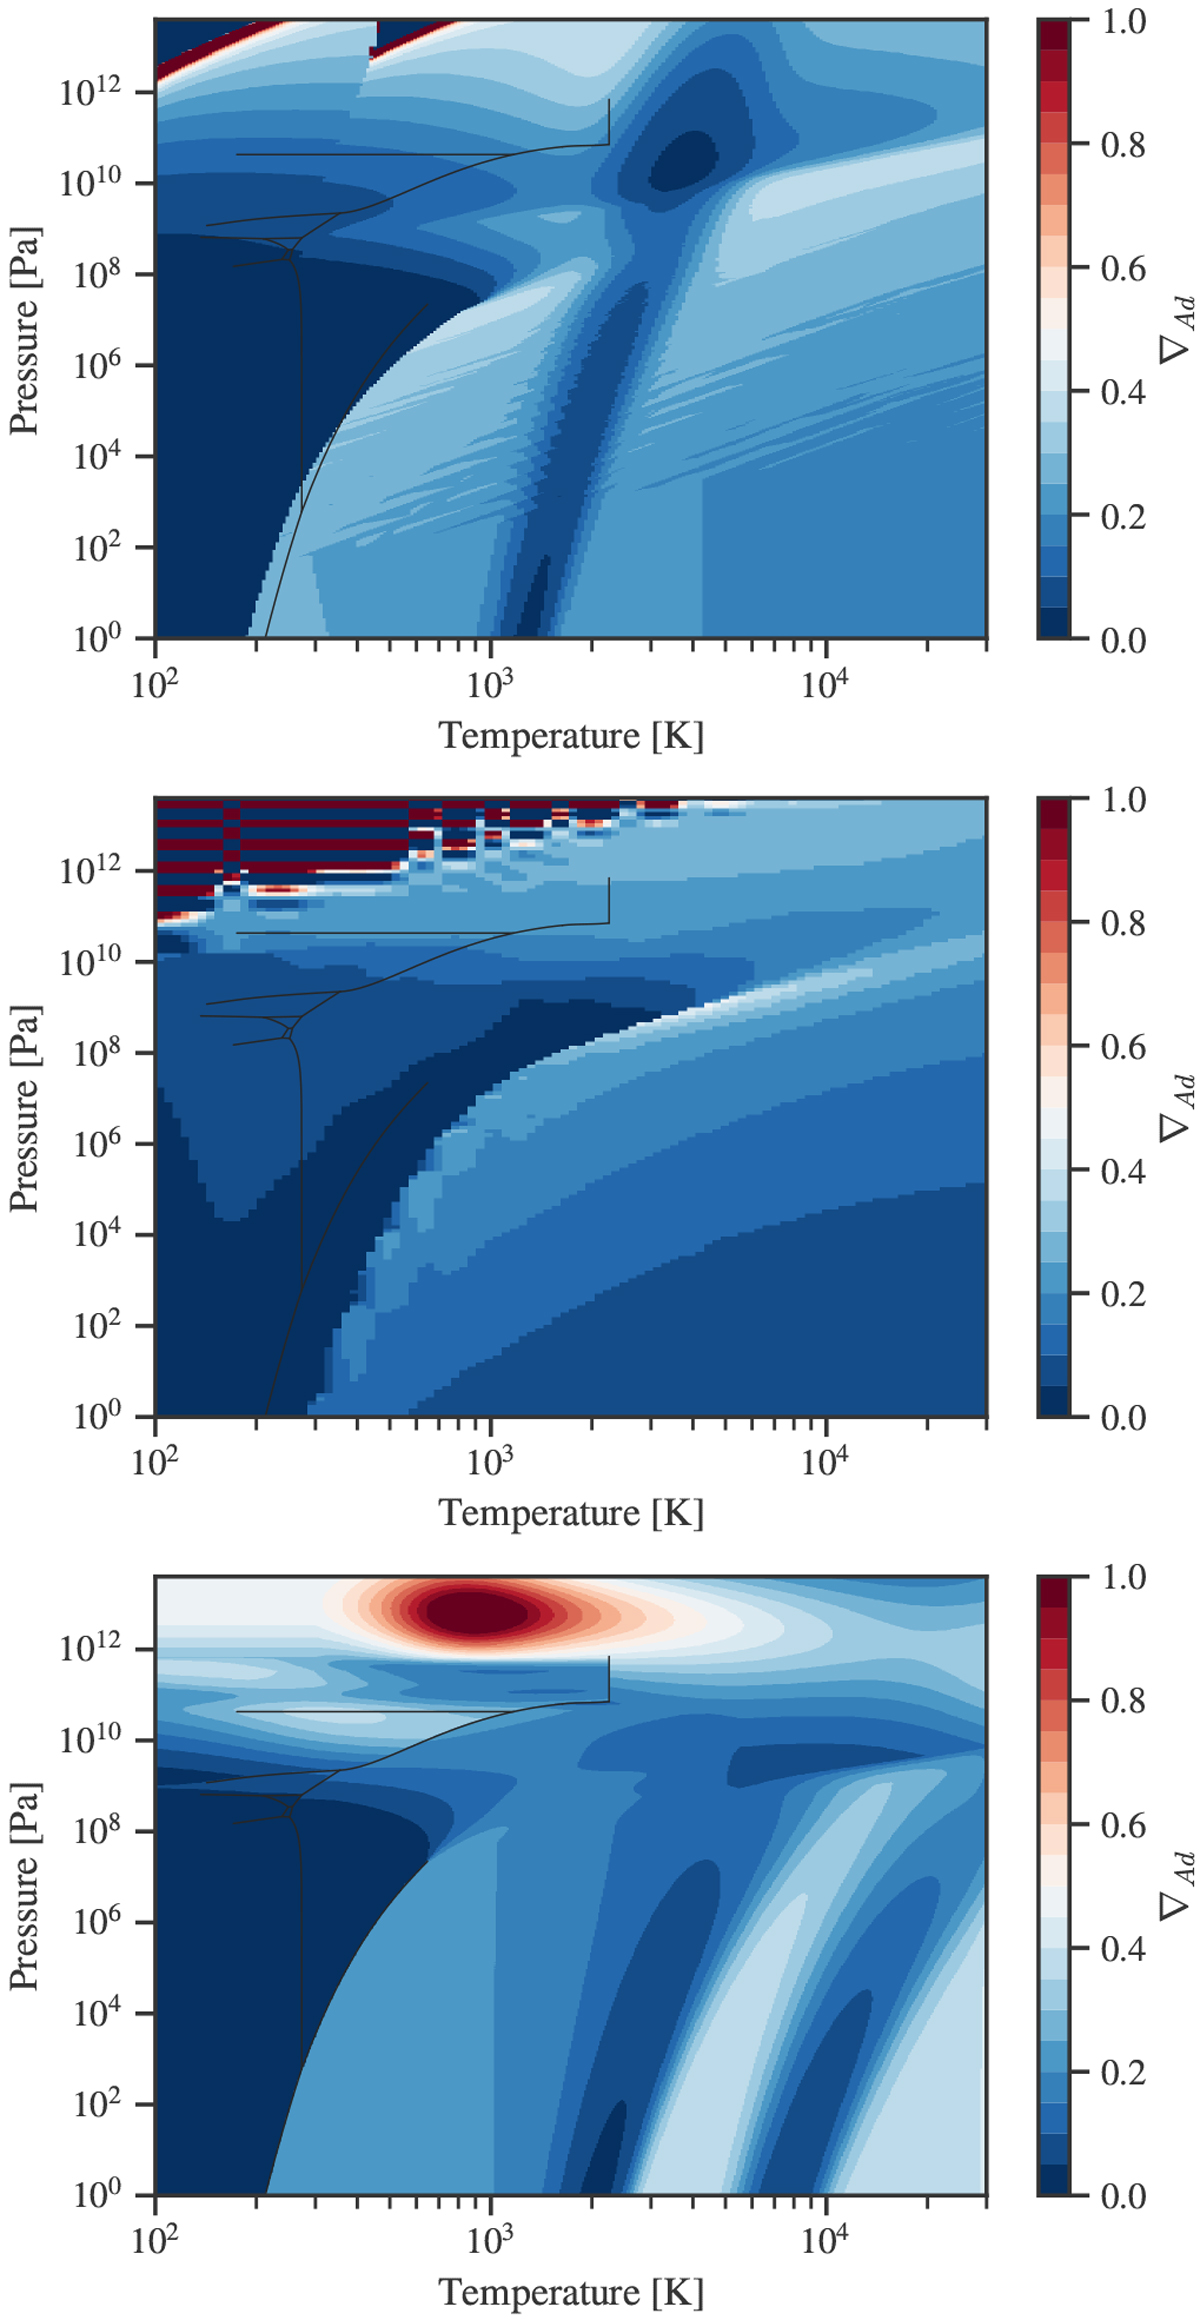
Adiabatic temperature gradient of ANEOS (top panel), QEOS (bottom panel), and the AQUA EoS (bottom panel) as a function of pressure and temperature. The black lines are the phase boundaries as in Fig. 4.
Current usage metrics show cumulative count of Article Views (full-text article views including HTML views, PDF and ePub downloads, according to the available data) and Abstracts Views on Vision4Press platform.
Data correspond to usage on the plateform after 2015. The current usage metrics is available 48-96 hours after online publication and is updated daily on week days.
Initial download of the metrics may take a while.