Fig. 4
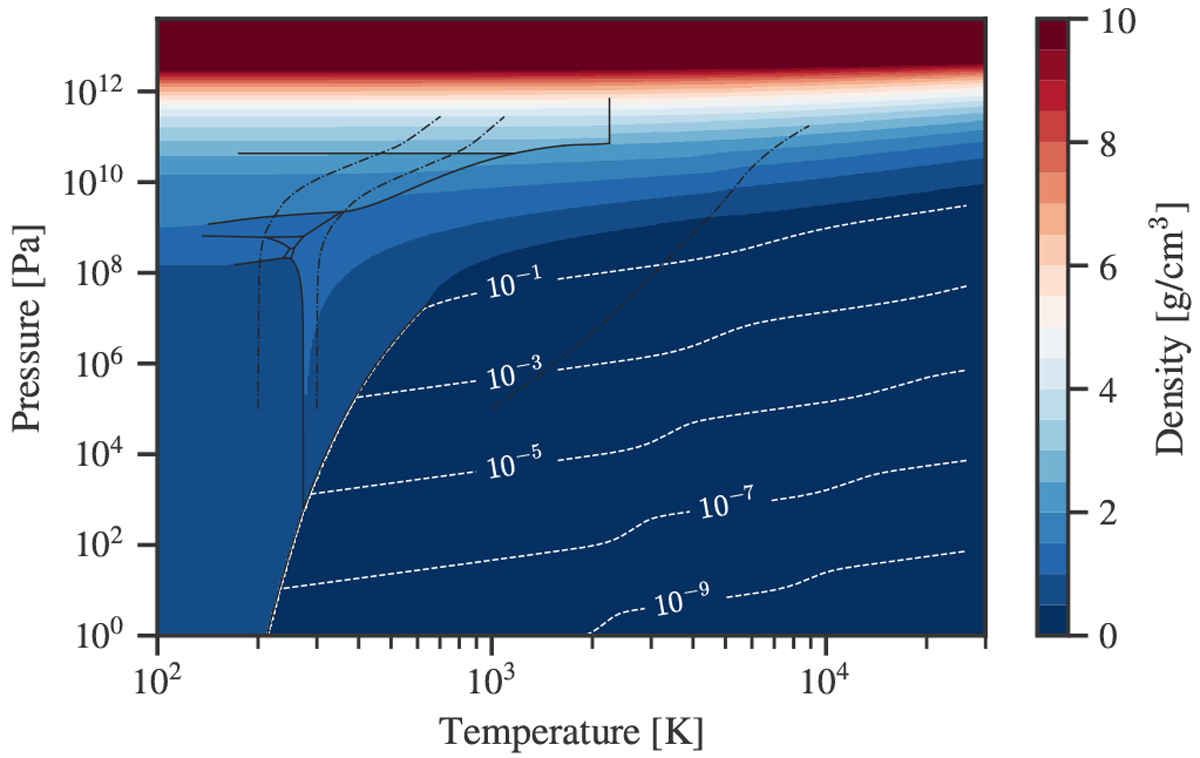
Density of H2O as afunction of pressure and temperature calculated with the collection of H2O EoS of this work. The various EoS used to generate this plot are listed in Table 1. The solid black lines mark the phase transition between the solid, liquid, and gaseous phase. The white dashed lines are the density contours for the region where the density is below unity. The dot dashed black lines are adiabats calculated for a 5 M⊕ sphere of pure H2O for different surface temperatures of 200, 300, and 1000 K.
Current usage metrics show cumulative count of Article Views (full-text article views including HTML views, PDF and ePub downloads, according to the available data) and Abstracts Views on Vision4Press platform.
Data correspond to usage on the plateform after 2015. The current usage metrics is available 48-96 hours after online publication and is updated daily on week days.
Initial download of the metrics may take a while.