Fig. 3
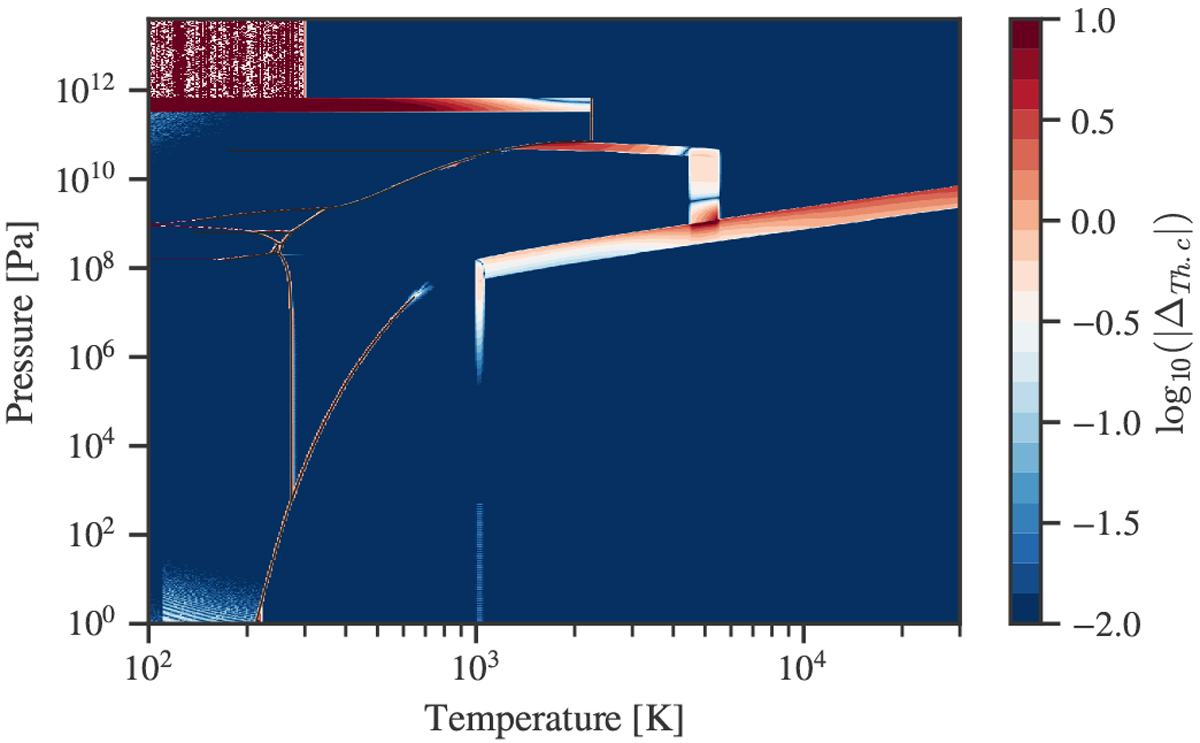
Thermodynamic consistency measure δTh.c. defined in Eq. (29), as a function of pressure and temperature. Along phase transitions, the region boundaries, and around the critical point deviations from the ideal thermodynamic behaviour can be seen. The rectangular patch in the top left originates from evaluating the M19-EoS at constant temperature.
Current usage metrics show cumulative count of Article Views (full-text article views including HTML views, PDF and ePub downloads, according to the available data) and Abstracts Views on Vision4Press platform.
Data correspond to usage on the plateform after 2015. The current usage metrics is available 48-96 hours after online publication and is updated daily on week days.
Initial download of the metrics may take a while.