Fig. 2
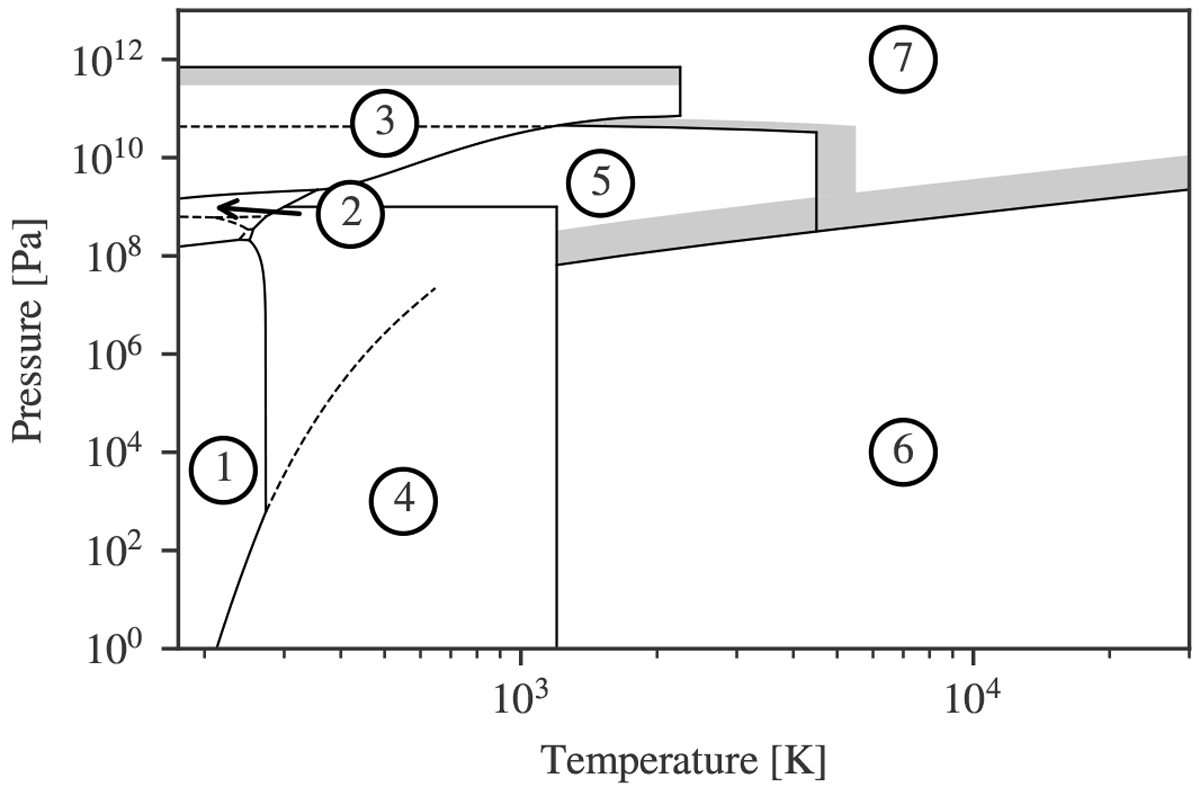
Phase diagram of H2O split into the seven regions listed in Table 1. Most region boundaries (solid lines) follow phase transition curves. The dashed lines are phase transitions that are not region boundaries, meaning the same EoS is used along the phase transition. The shaded areas show where neighbouring regions have to be interpolated. Region 7, where the EoS of Mazevet et al. (2019) is used, expands to temperatures up to 105 K.
Current usage metrics show cumulative count of Article Views (full-text article views including HTML views, PDF and ePub downloads, according to the available data) and Abstracts Views on Vision4Press platform.
Data correspond to usage on the plateform after 2015. The current usage metrics is available 48-96 hours after online publication and is updated daily on week days.
Initial download of the metrics may take a while.