Fig. 12
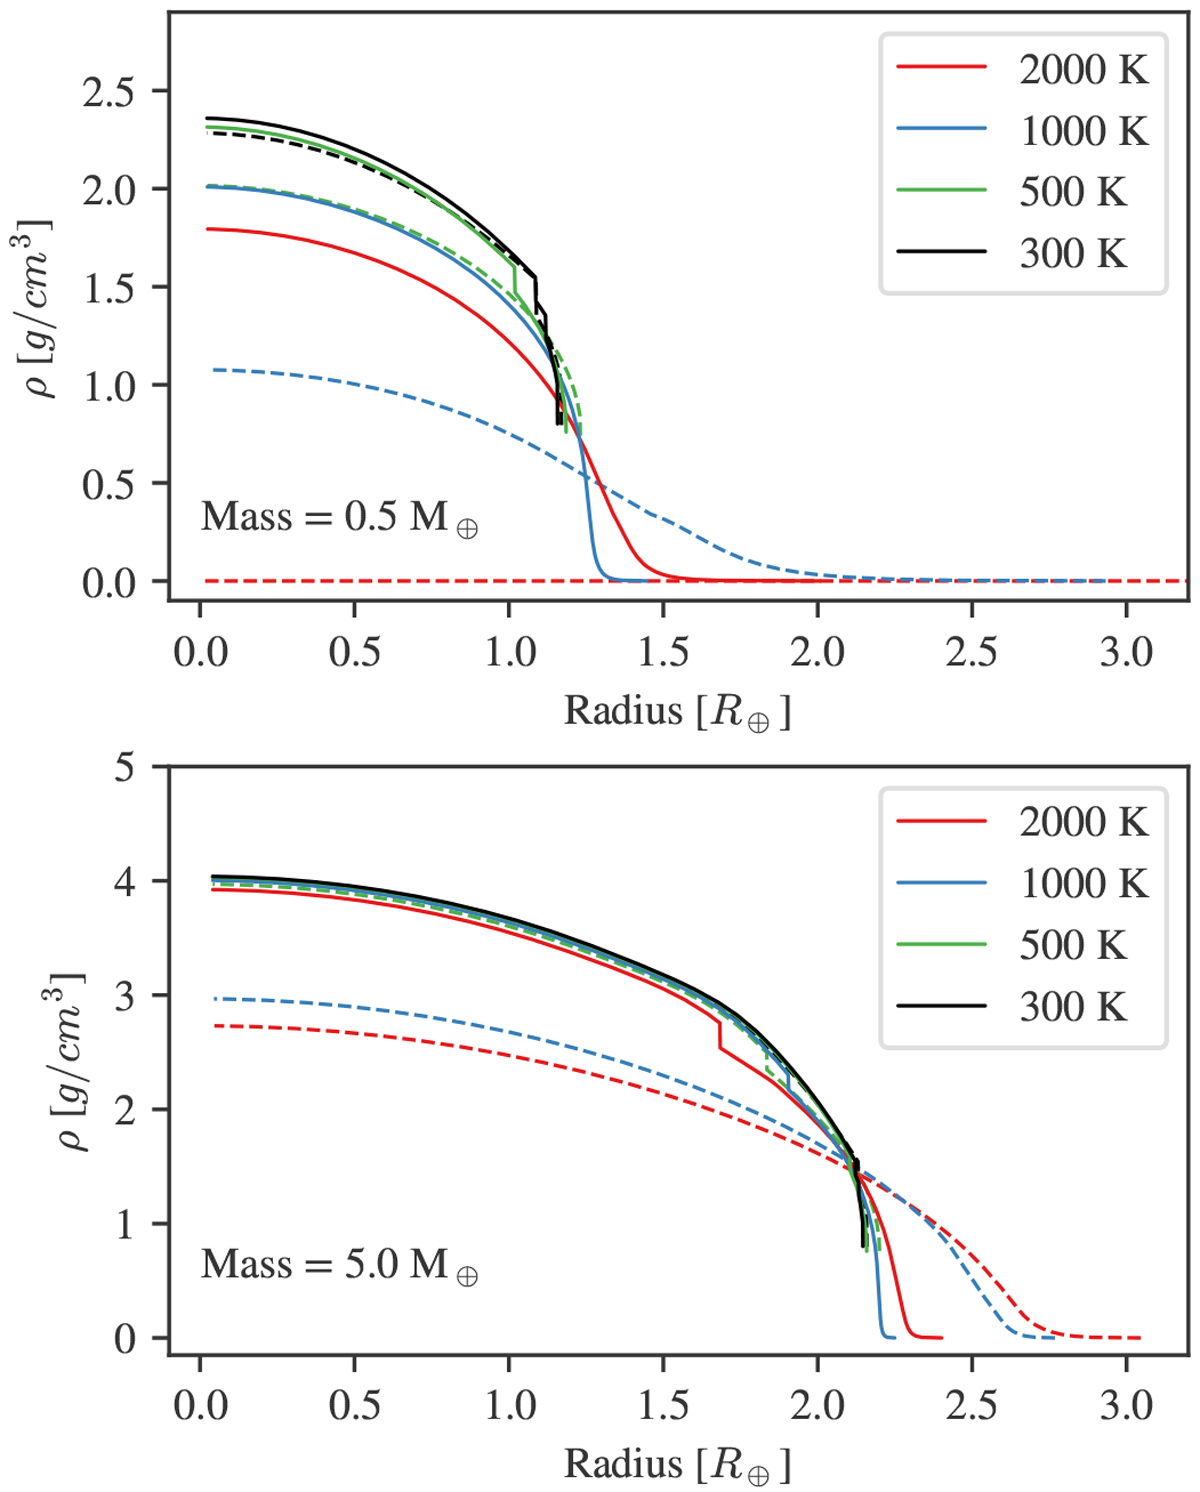
Density profiles of a water sphere using either an isothermal temperature profile (solid) or an adiabatic temperature gradient (dashed). The surface temperatures are set to four different values (black = 300 K, green = 500 K, blue = 1000 K, red = 2000 K). Following a similar comparison from Mazevet et al. (2019), we set the surface pressure to the corresponding pressure on the vapour curve, unless the surface temperature is above the critical point, where the surface pressure is set to 1 bar. Bottom panel: the black dashed curve is overlapped by the solid black and green curves.
Current usage metrics show cumulative count of Article Views (full-text article views including HTML views, PDF and ePub downloads, according to the available data) and Abstracts Views on Vision4Press platform.
Data correspond to usage on the plateform after 2015. The current usage metrics is available 48-96 hours after online publication and is updated daily on week days.
Initial download of the metrics may take a while.