Fig. F.2.
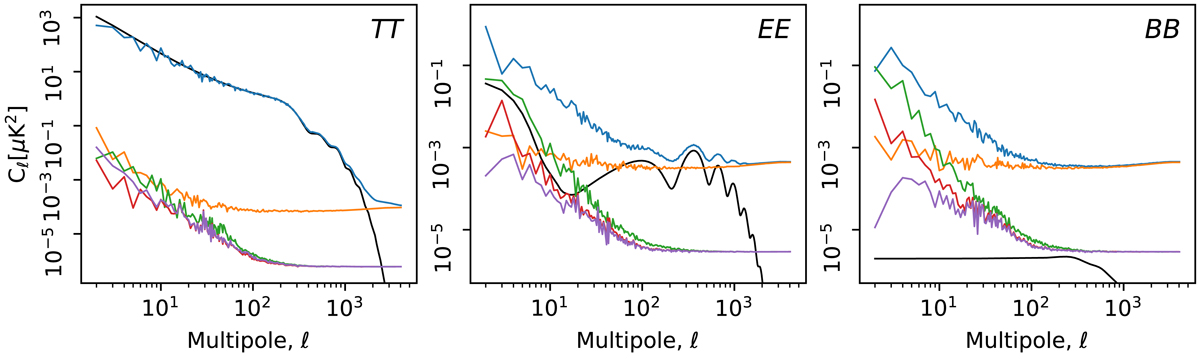
Power spectra of the simulated full-mission ADCNL effect over 50% of the sky, corrected for the sky fraction. The green curve shows the full, unmitigated effect. Red shows the residual after the linear (first order) gain correction, and magenta shows the residual after applying the gain and distortion templates (second order), as is done in NPIPE. For scale, the power spectrum of the full 143 GHz frequency map is shown in blue, and an instrumental noise estimate (from the half-ring, half-difference map) is shown in orange. The theoretical input power spectrum (τ = 0.06) used in the simulation is in black. The residual maps are shown in Fig. F.1. The EE residuals are deconvolved from the NPIPE transfer function (Sect. 4.3).
Current usage metrics show cumulative count of Article Views (full-text article views including HTML views, PDF and ePub downloads, according to the available data) and Abstracts Views on Vision4Press platform.
Data correspond to usage on the plateform after 2015. The current usage metrics is available 48-96 hours after online publication and is updated daily on week days.
Initial download of the metrics may take a while.