Fig. F.1.
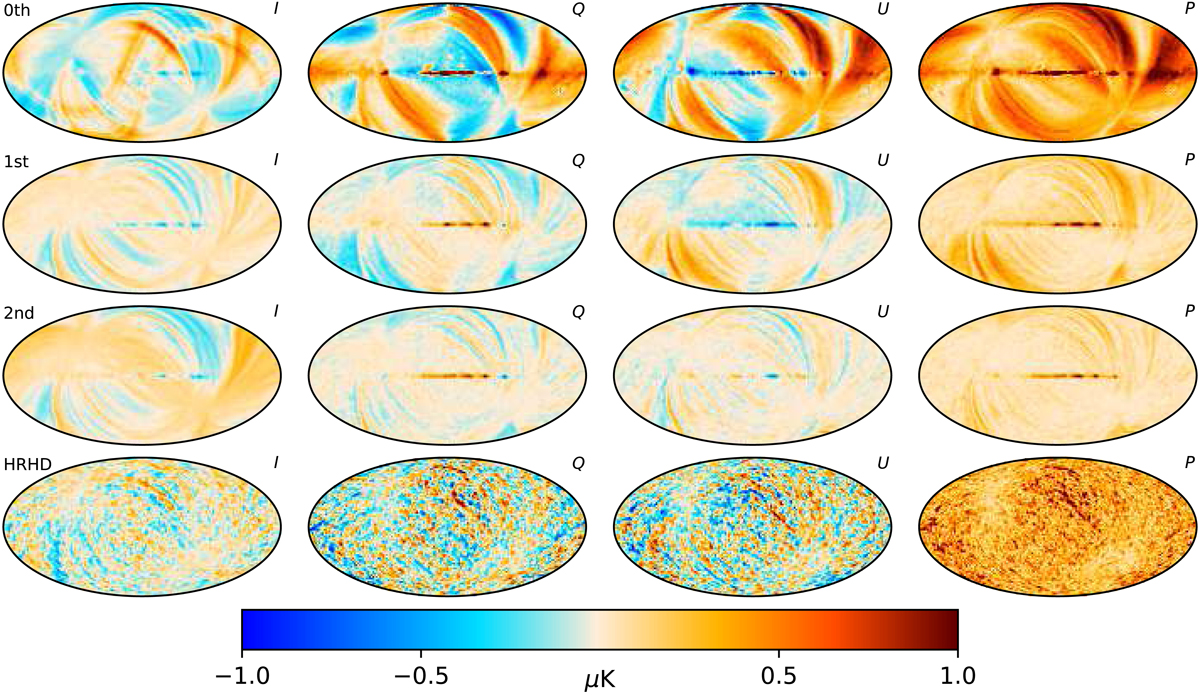
Simulated full-mission maps of HFI ADCNL at 143 GHz. Top row: full, unmitigated effect. Second row: residuals after fitting and correcting ADCNL using the linear gain model (first-order correction), as was done in PR3. Third row: residual after fitting for gain and distortion terms, as is done in NPIPE. The NPIPE transfer function (Sect. 4.3) applies to both the full and ADCNL-free simulations. Fourth and last row: half-ring, half-difference map from the same simulation to compare the magnitude of the effect to instrumental noise. All maps were smoothed with a 3° Gaussian beam. The residual power spectra are shown in Fig. F.2.
Current usage metrics show cumulative count of Article Views (full-text article views including HTML views, PDF and ePub downloads, according to the available data) and Abstracts Views on Vision4Press platform.
Data correspond to usage on the plateform after 2015. The current usage metrics is available 48-96 hours after online publication and is updated daily on week days.
Initial download of the metrics may take a while.