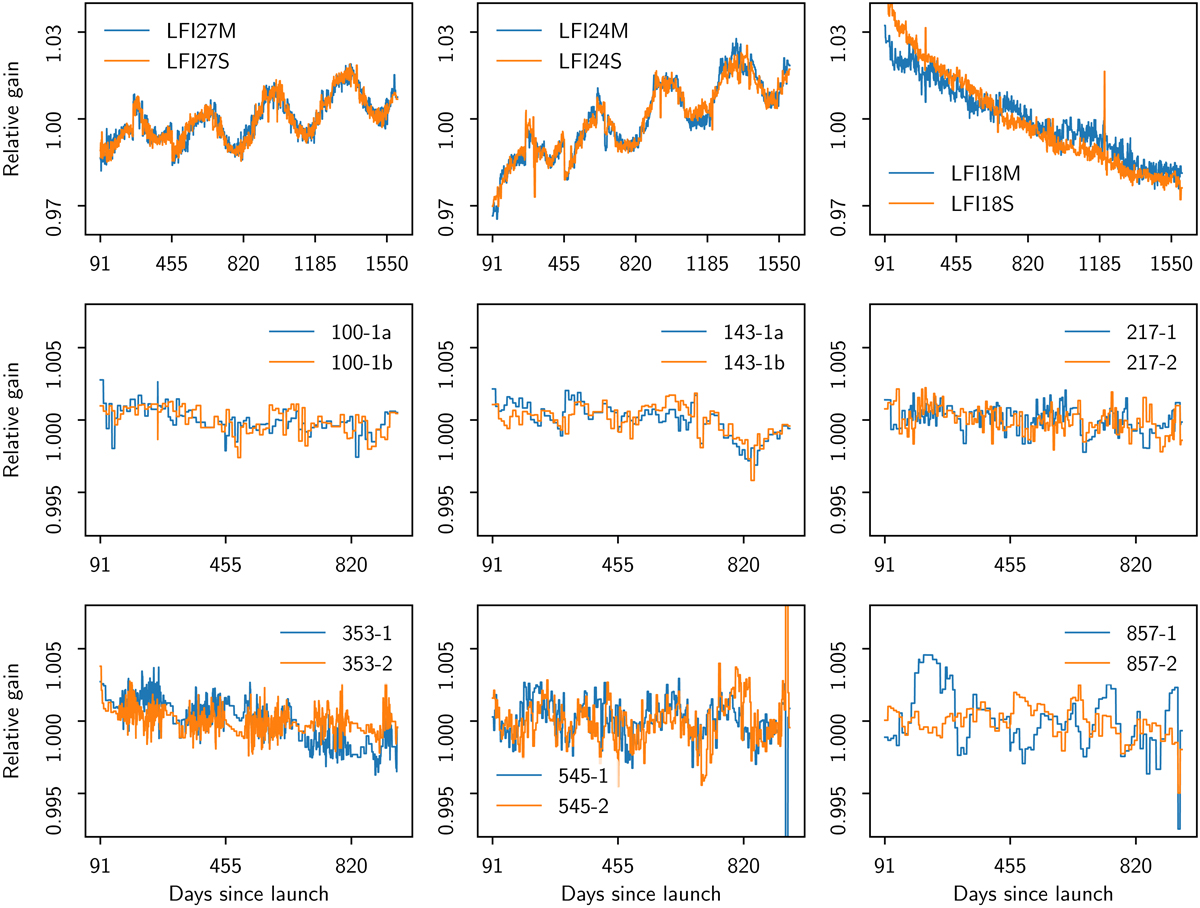
Fig. 9.

Sampling of measured gain fluctuations at all Planck frequencies. The top row shows 30, 44, and 70 GHz, from left to right, for representative detectors, with “M” and “S” referring to “main” and “side” (see Planck Collaboration III 2020). The second and third rows show HFI frequencies, indicated in the detector names. The vertical lines indicate complete observing years. Seasonal effects due to Solar distance are apparent in the 30 and 44 GHz gains, as well as discontinuities from switching to the redundant 20 K sorption-cooler system on day 455 and changing the transponder setting on day 270.
Current usage metrics show cumulative count of Article Views (full-text article views including HTML views, PDF and ePub downloads, according to the available data) and Abstracts Views on Vision4Press platform.
Data correspond to usage on the plateform after 2015. The current usage metrics is available 48-96 hours after online publication and is updated daily on week days.
Initial download of the metrics may take a while.


