Fig. D.1.
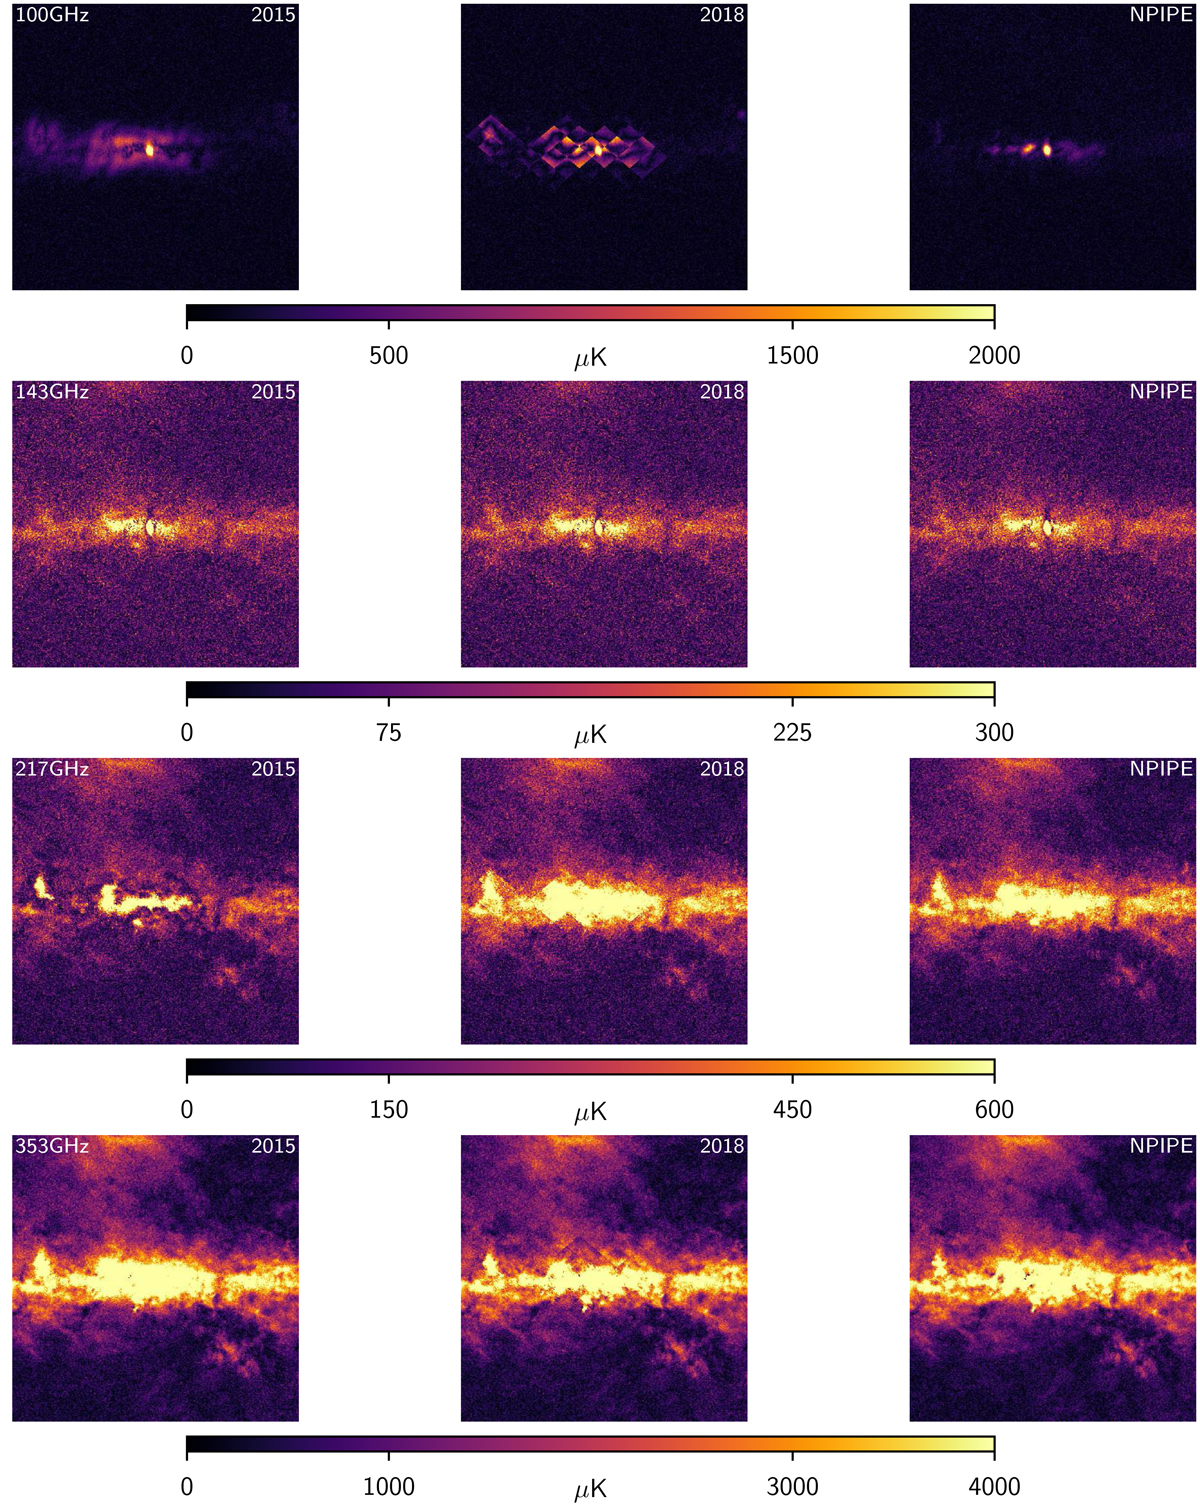
Polarization amplitude in an 8°× 8°patch centred around the Galactic centre. The linear colour scale was chosen to demonstrate the low-resolution CO template residuals in the 2018 maps. The residuals are most pronounced at 100 GHz, where the CO corrections are largest, and absent at 143 GHz, where there is no CO correction needed. Since the 2015 maps are not corrected for bandpass mismatch, they do not display the same artefacts..
Current usage metrics show cumulative count of Article Views (full-text article views including HTML views, PDF and ePub downloads, according to the available data) and Abstracts Views on Vision4Press platform.
Data correspond to usage on the plateform after 2015. The current usage metrics is available 48-96 hours after online publication and is updated daily on week days.
Initial download of the metrics may take a while.