Free Access
Fig. 86.
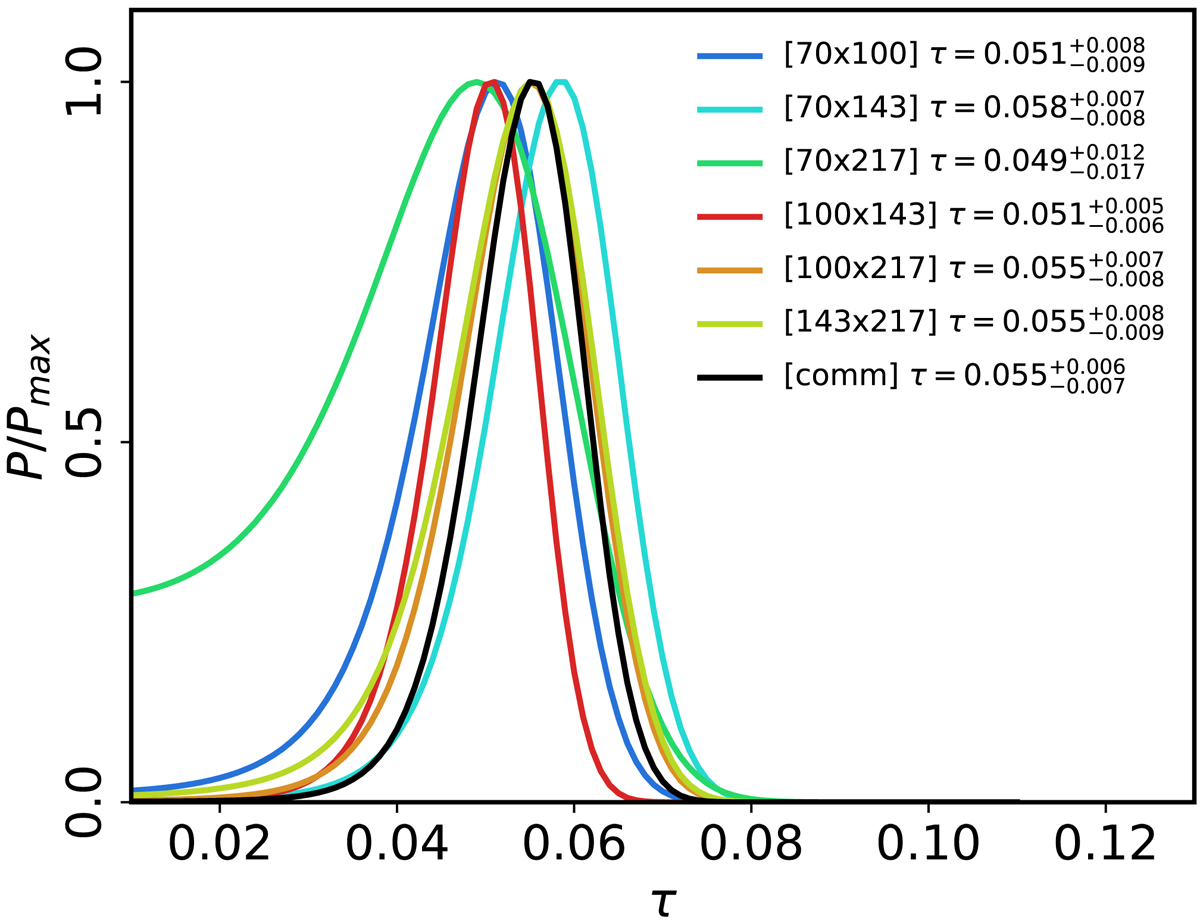
Optical depth τ posterior depending on the cross-spectra used in the likelihood. We use frequency-cleaned maps from 70 to 217 GHz. We also show the posterior for the cross-power spectrum estimated using COMMANDER detector-set maps.
Current usage metrics show cumulative count of Article Views (full-text article views including HTML views, PDF and ePub downloads, according to the available data) and Abstracts Views on Vision4Press platform.
Data correspond to usage on the plateform after 2015. The current usage metrics is available 48-96 hours after online publication and is updated daily on week days.
Initial download of the metrics may take a while.