Fig. 80.
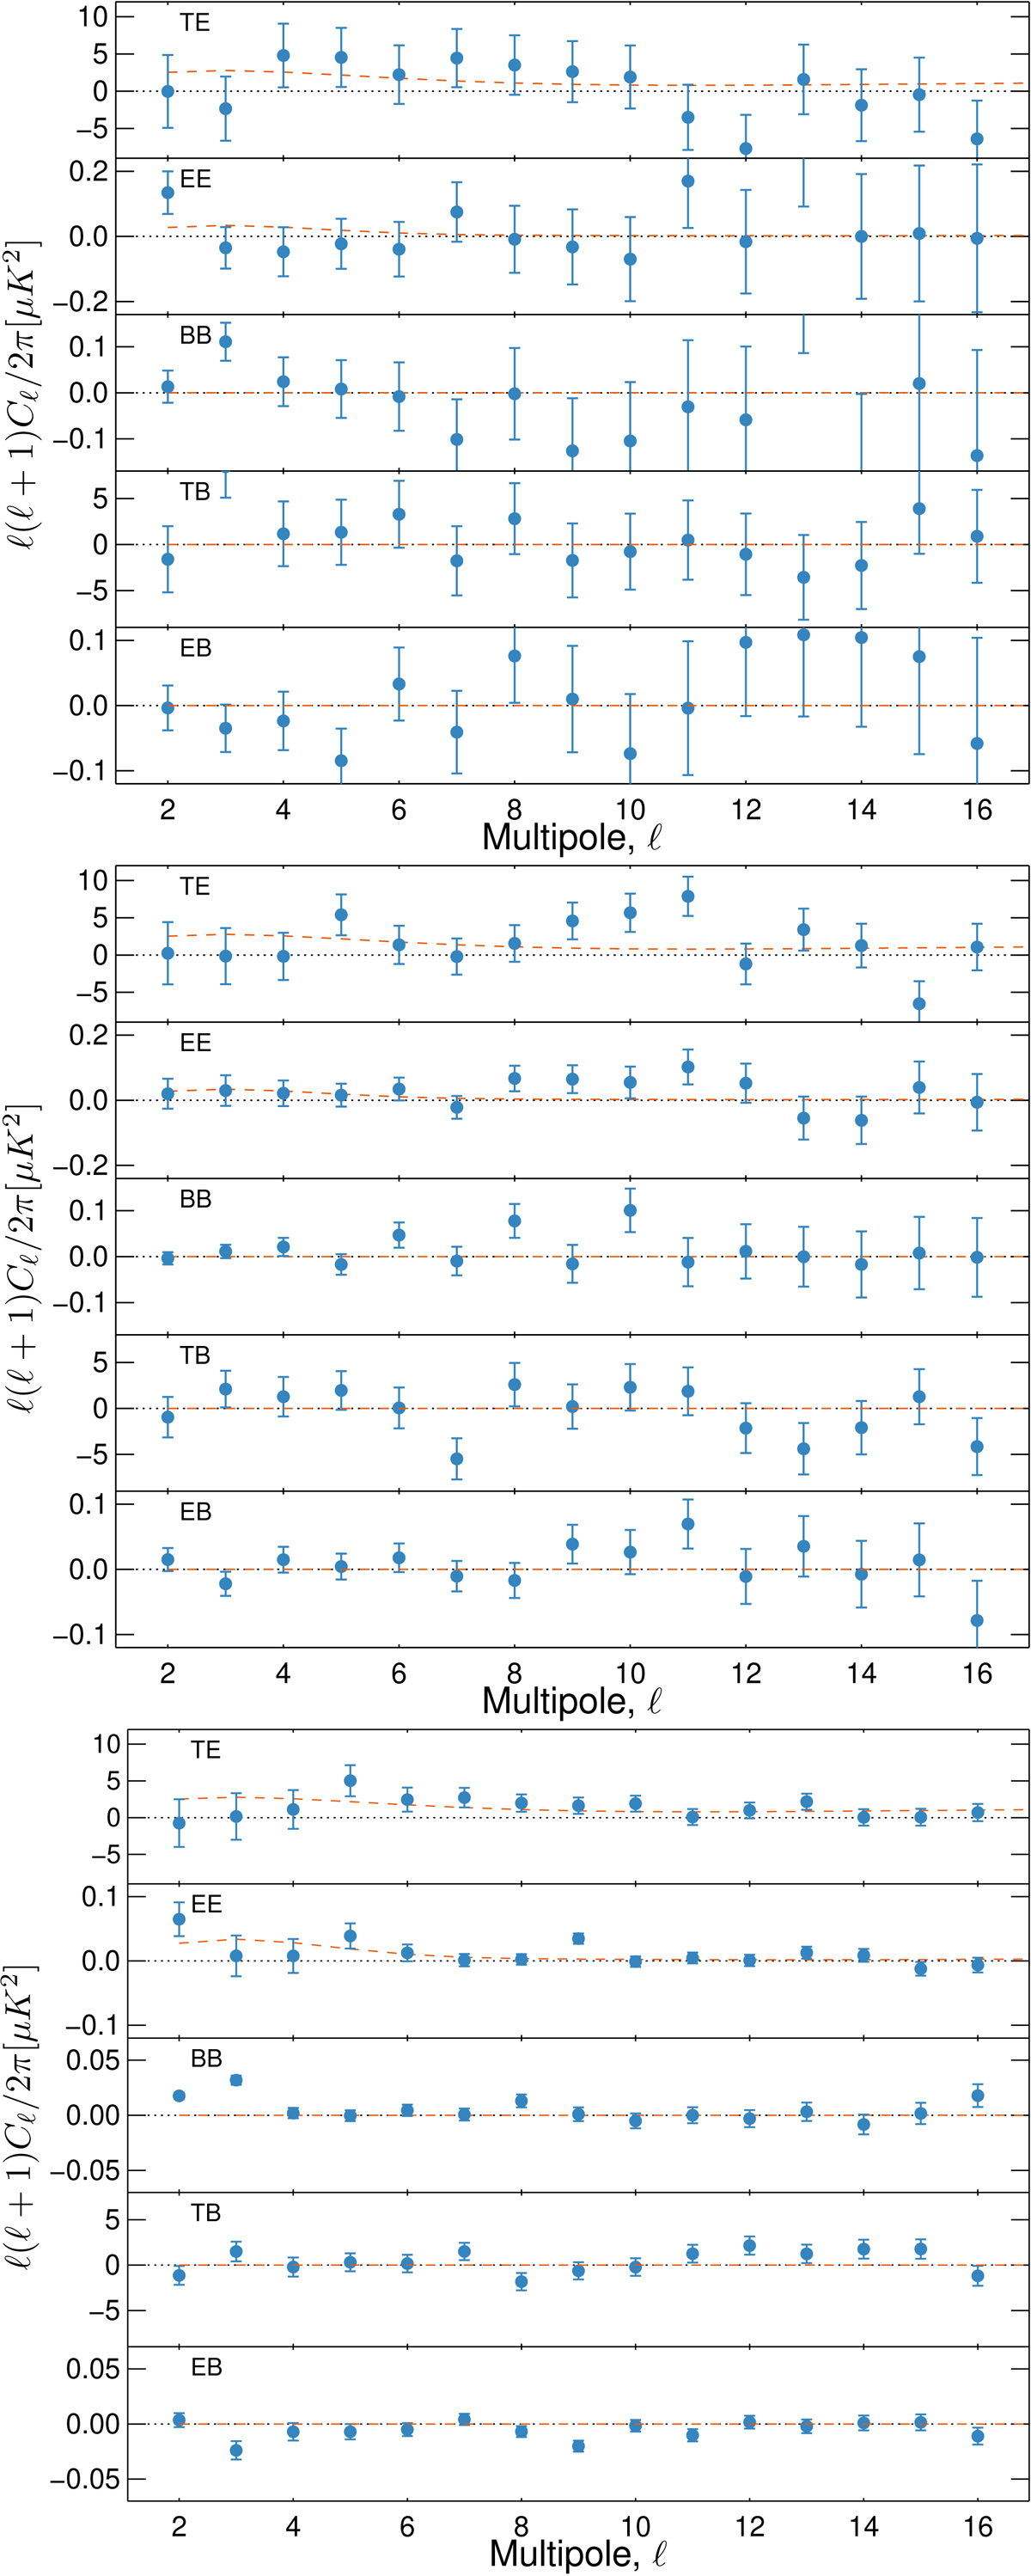
Power spectra of template-cleaned, low-resolution maps. From top to bottom, the panels show results for 44, 70, and 100 GHz, respectively. The dashed red lines show a model with τ = 0.06 (and not a fit to the data). Spectra for TT are not shown, since in all cases the Commander 2015 map is used for temperature. The polarization mask was R1.8x for 44 and 70 GHz, and R0.9 for 100 GHz. In all cases, we used the Commander 2015 mask for temperature.
Current usage metrics show cumulative count of Article Views (full-text article views including HTML views, PDF and ePub downloads, according to the available data) and Abstracts Views on Vision4Press platform.
Data correspond to usage on the plateform after 2015. The current usage metrics is available 48-96 hours after online publication and is updated daily on week days.
Initial download of the metrics may take a while.