Fig. 79.
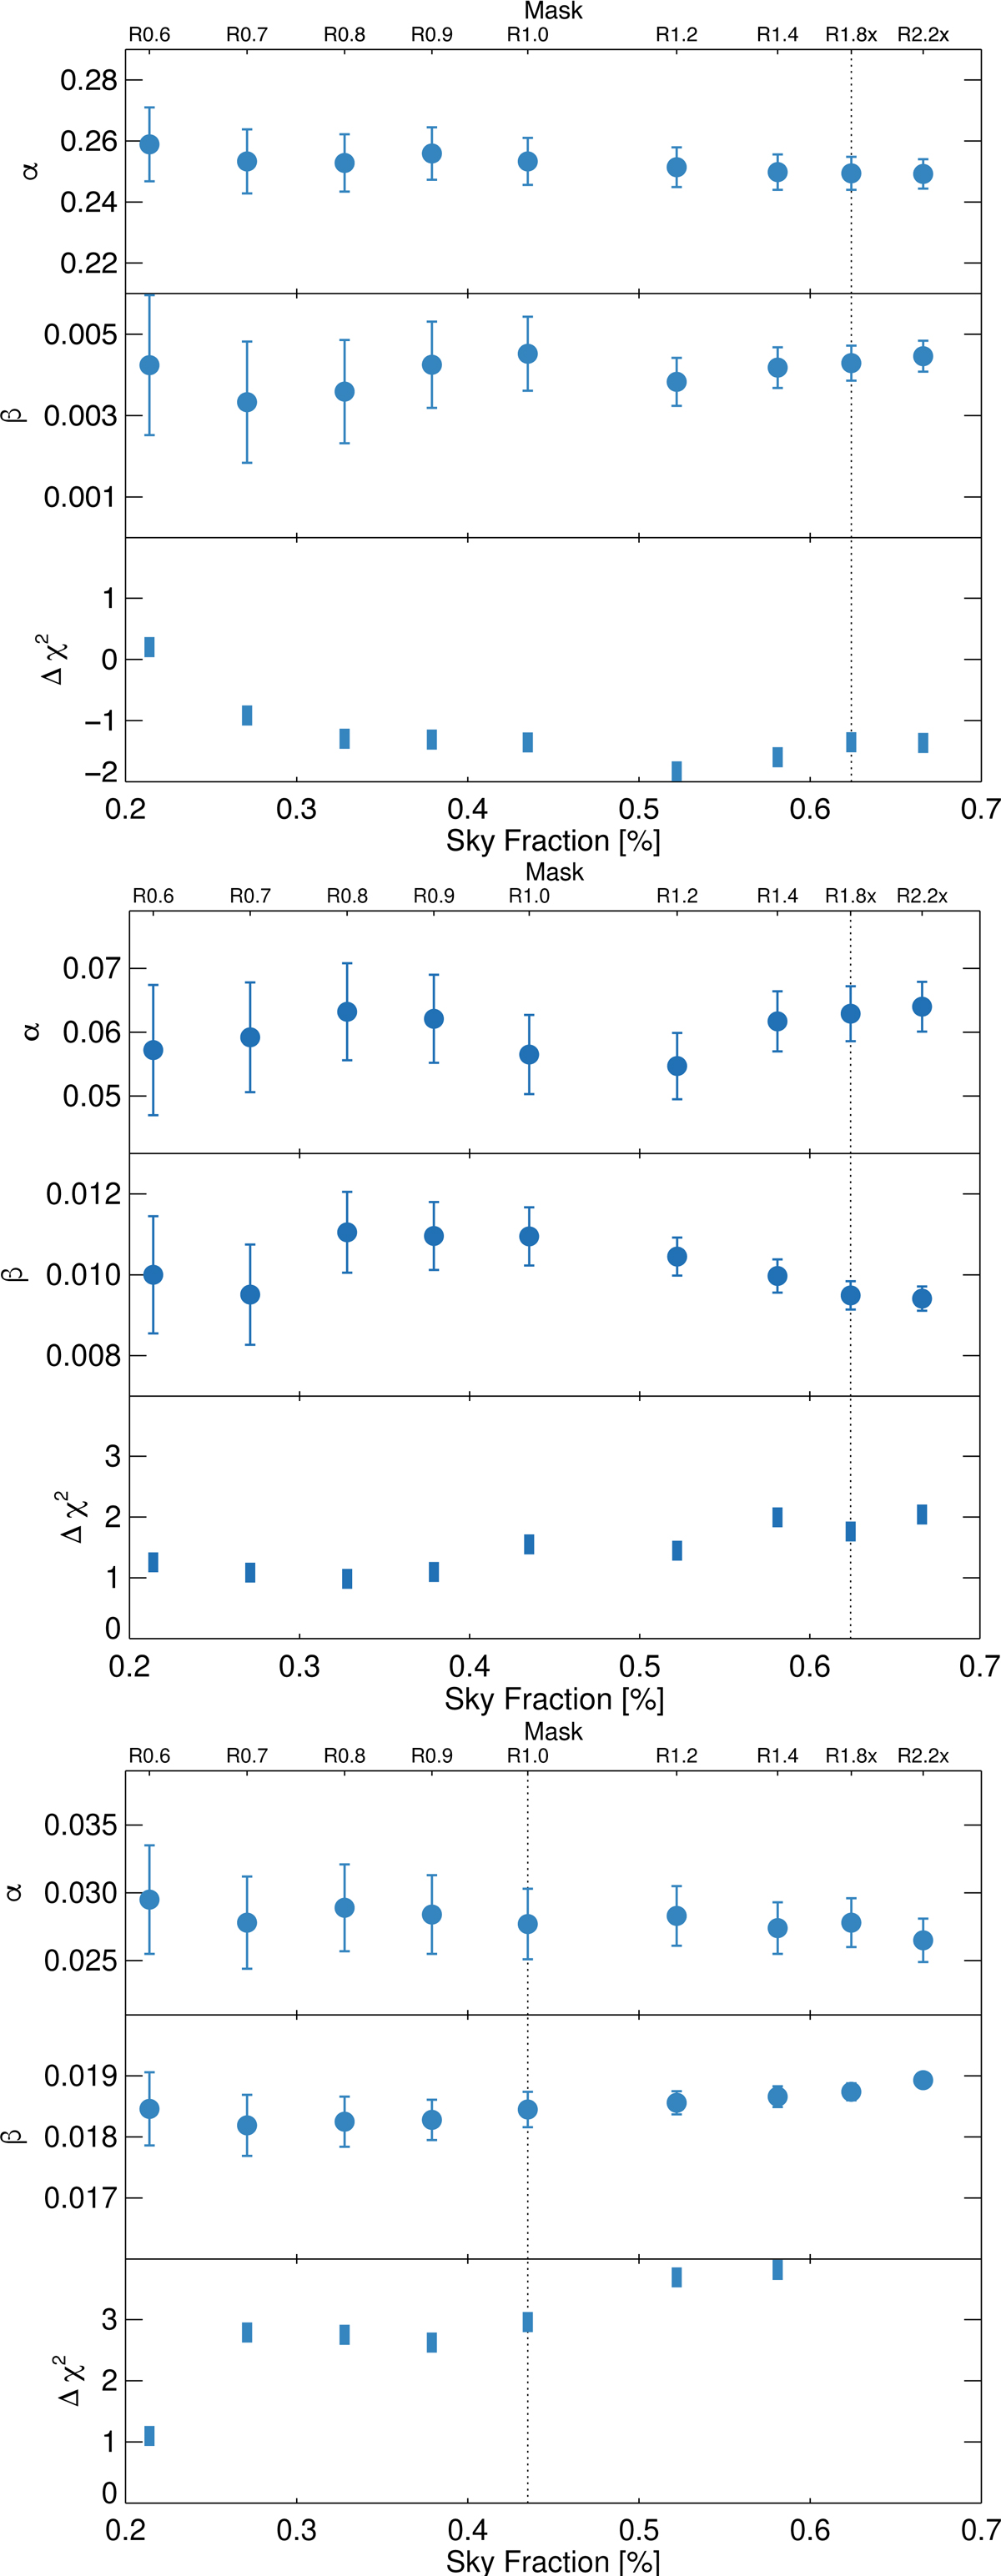
Scaling coefficients for synchrotron spectral index α and thermal dust emissivity β, and excess ![]() , for 9 different masks. The panels from top to bottom show results at 44, 70, and 100 GHz, respectively. For 44 and 70 GHz data, the dotted vertical line shows the mask used for parameter estimation with the low-ℓ 2018 LFI likelihood, while for 100 GHz data it shows the largest mask for which Δχ2 ≤ 3.
, for 9 different masks. The panels from top to bottom show results at 44, 70, and 100 GHz, respectively. For 44 and 70 GHz data, the dotted vertical line shows the mask used for parameter estimation with the low-ℓ 2018 LFI likelihood, while for 100 GHz data it shows the largest mask for which Δχ2 ≤ 3.
Current usage metrics show cumulative count of Article Views (full-text article views including HTML views, PDF and ePub downloads, according to the available data) and Abstracts Views on Vision4Press platform.
Data correspond to usage on the plateform after 2015. The current usage metrics is available 48-96 hours after online publication and is updated daily on week days.
Initial download of the metrics may take a while.