Fig. 76.
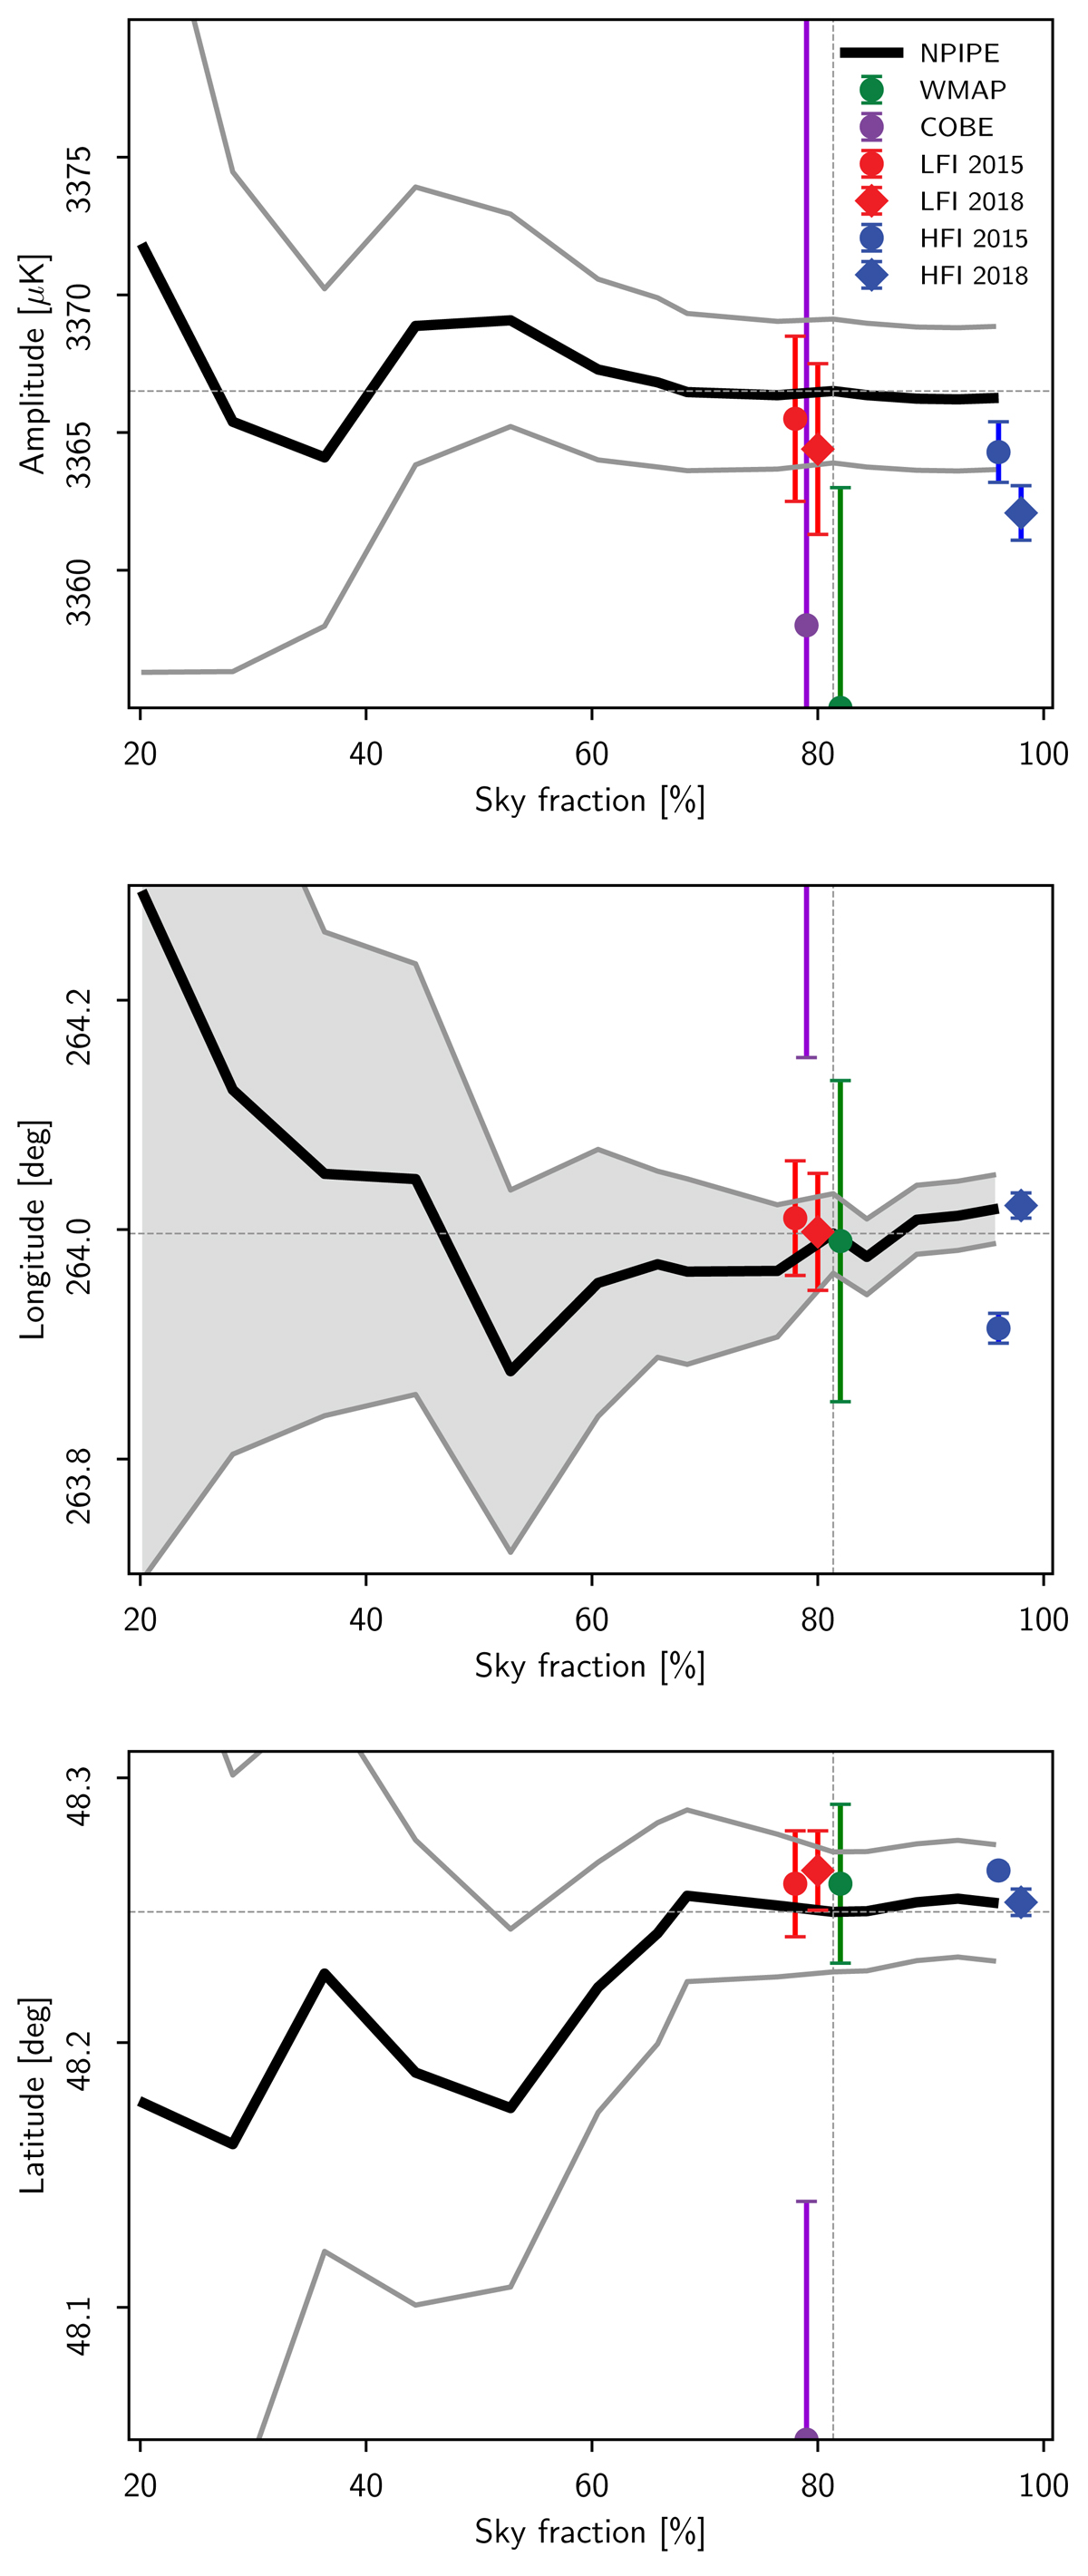
CMB Solar dipole parameters as a function of sky fraction, as estimated from NPIPE data. The solid black lines show the posterior mean derived with a Wiener-filter estimator, and the grey bands show corresponding ±1 σ confidence regions including both statistical and systematic uncertainties. From top to bottom, the three panels show amplitude, longitude, and latitude parameters. For comparison, estimates from COBE, WMAP, and Planck LFI and HFI are shown as individual coloured data points. The dotted lines represent the NPIPE values that are adopted as final optimal estimates, and summarized in Table 11, defined with a sky fraction of fsky = 0.81.
Current usage metrics show cumulative count of Article Views (full-text article views including HTML views, PDF and ePub downloads, according to the available data) and Abstracts Views on Vision4Press platform.
Data correspond to usage on the plateform after 2015. The current usage metrics is available 48-96 hours after online publication and is updated daily on week days.
Initial download of the metrics may take a while.