Free Access
Fig. 72.
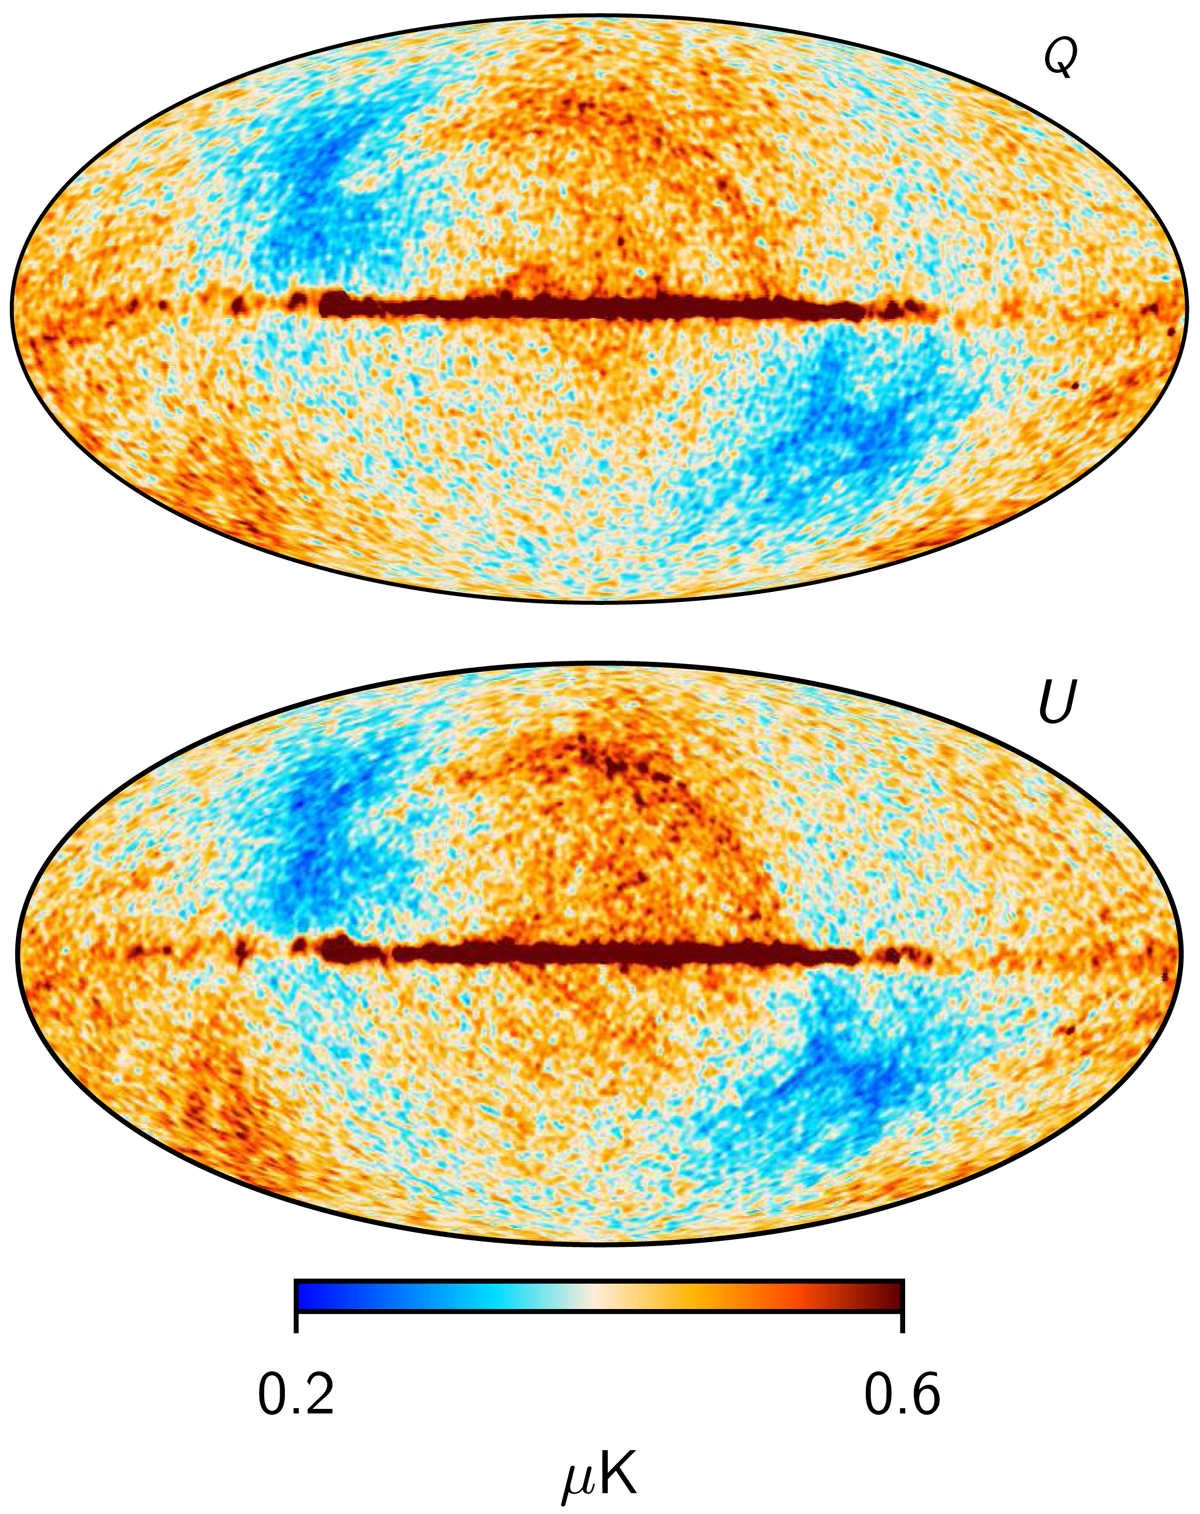
Standard deviation evaluated from 100 end-to-end NPIPE full-mission simulations of CMB Q and U maps, as derived with Commander. Both maps are smoothed to 2° FWHM.
Current usage metrics show cumulative count of Article Views (full-text article views including HTML views, PDF and ePub downloads, according to the available data) and Abstracts Views on Vision4Press platform.
Data correspond to usage on the plateform after 2015. The current usage metrics is available 48-96 hours after online publication and is updated daily on week days.
Initial download of the metrics may take a while.