Free Access
Fig. 71.
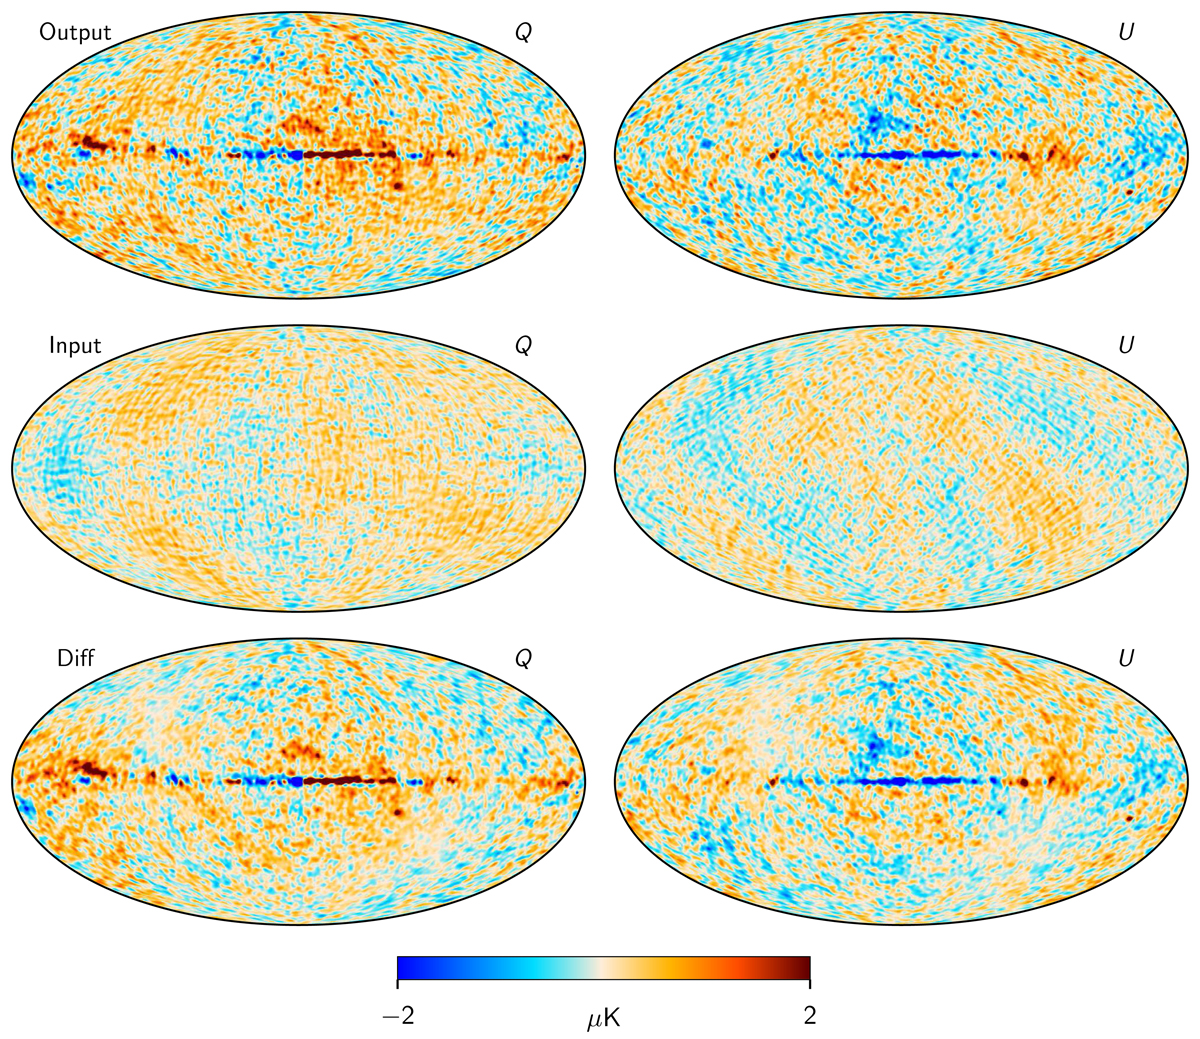
Comparison of end-to-end reconstructed (top row) and input (middle row) NPIPE simulations for the Stokes Q and U CMB maps. The bottom row shows the difference between the output and input sky maps. All maps are smoothed to a common angular resolution of 2° FWHM.
Current usage metrics show cumulative count of Article Views (full-text article views including HTML views, PDF and ePub downloads, according to the available data) and Abstracts Views on Vision4Press platform.
Data correspond to usage on the plateform after 2015. The current usage metrics is available 48-96 hours after online publication and is updated daily on week days.
Initial download of the metrics may take a while.