Free Access
Fig. 69.
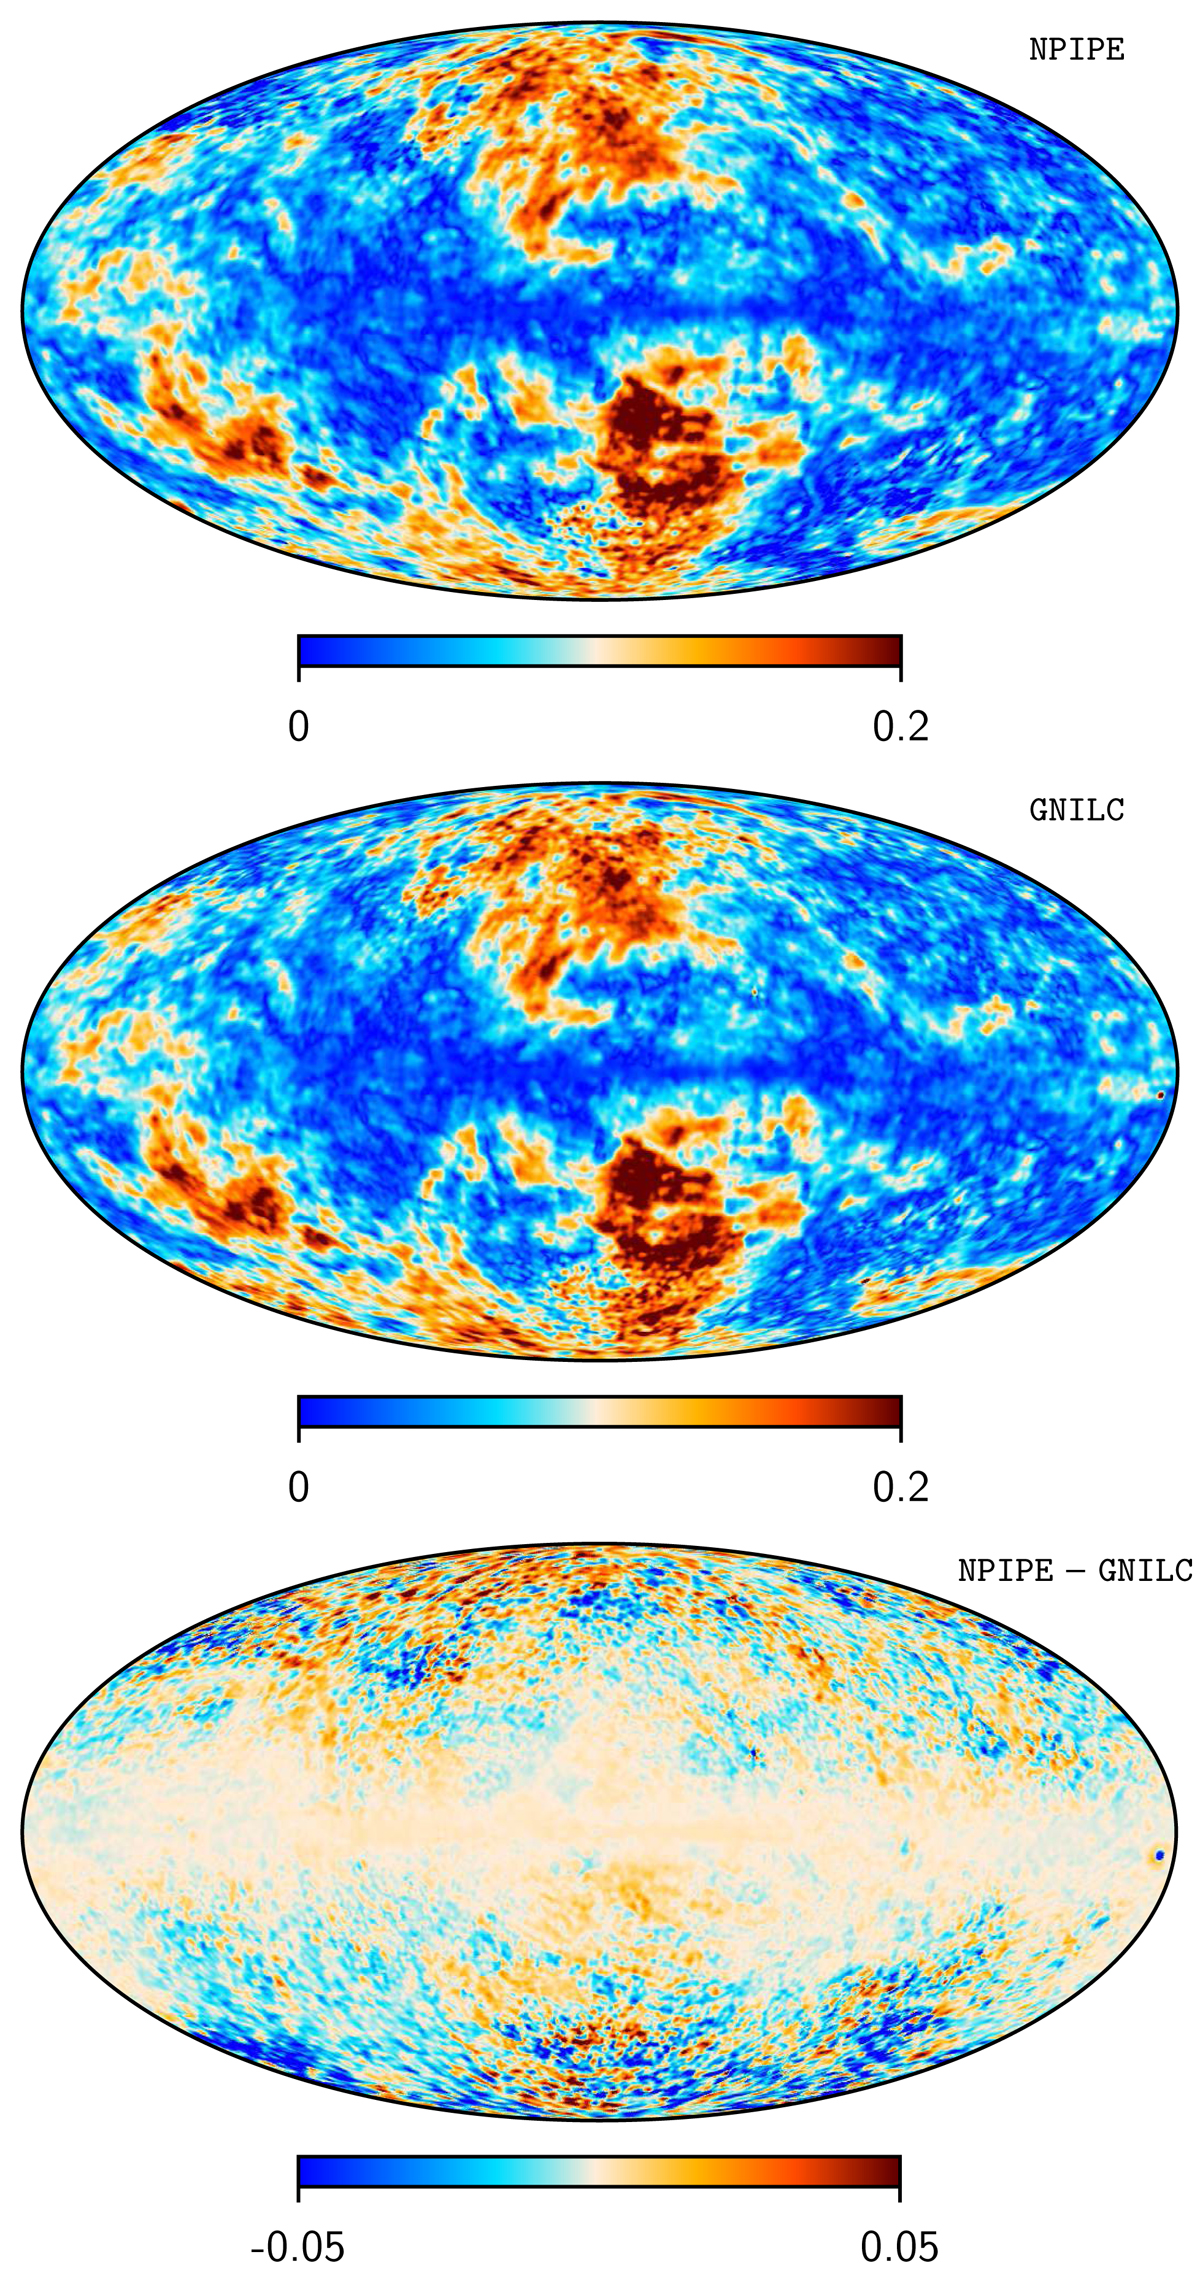
Comparison of thermal dust polarization-fraction maps, as evaluated from the NPIPE (top) and GNILC 2018 (middle) data sets, and a difference map (bottom) between the two. All maps are smoothed to 80′ FWHM. We have subtracted a monopole of 389 μK from the GNILC intensity map (Planck Collaboration XI 2019).
Current usage metrics show cumulative count of Article Views (full-text article views including HTML views, PDF and ePub downloads, according to the available data) and Abstracts Views on Vision4Press platform.
Data correspond to usage on the plateform after 2015. The current usage metrics is available 48-96 hours after online publication and is updated daily on week days.
Initial download of the metrics may take a while.