Fig. 67.
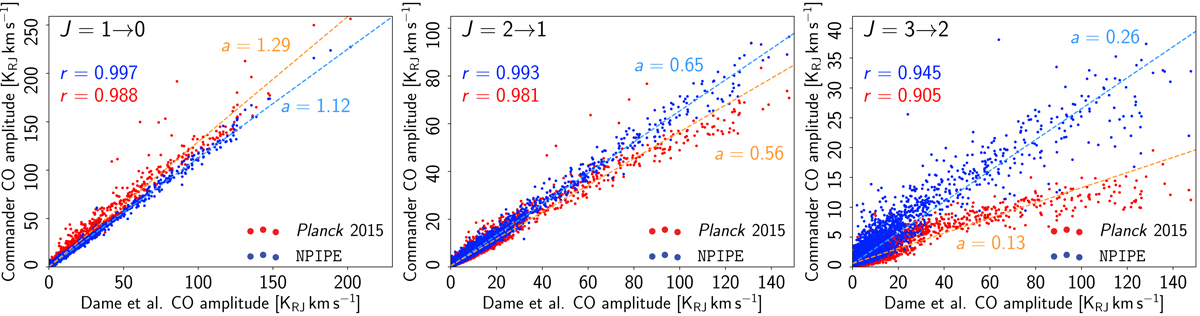
Comparison of T–T scatter plots evaluated between the Dame et al. CO map (Dame et al. 2001) and the Commander NPIPE (blue) and Planck 2015 (red) CO maps. Panels show, from left to right, results for the CO J = 1 → 0, J = 2 → 1, and J = 3 → 2 line maps, respectively. All maps have been smoothed to 1°FWHM, and pixelized with Nside = 64. The parameter marked by “a” is the best-fit linear slope of the scatter plot including values between 0.01 and 150 KRJ km s−1 of the Dame et al. J = 1 → 0 map. The parameter r is the Pearson’s correlation coefficient between Dame et al. and the respective CO amplitudes.
Current usage metrics show cumulative count of Article Views (full-text article views including HTML views, PDF and ePub downloads, according to the available data) and Abstracts Views on Vision4Press platform.
Data correspond to usage on the plateform after 2015. The current usage metrics is available 48-96 hours after online publication and is updated daily on week days.
Initial download of the metrics may take a while.