Fig. 65.
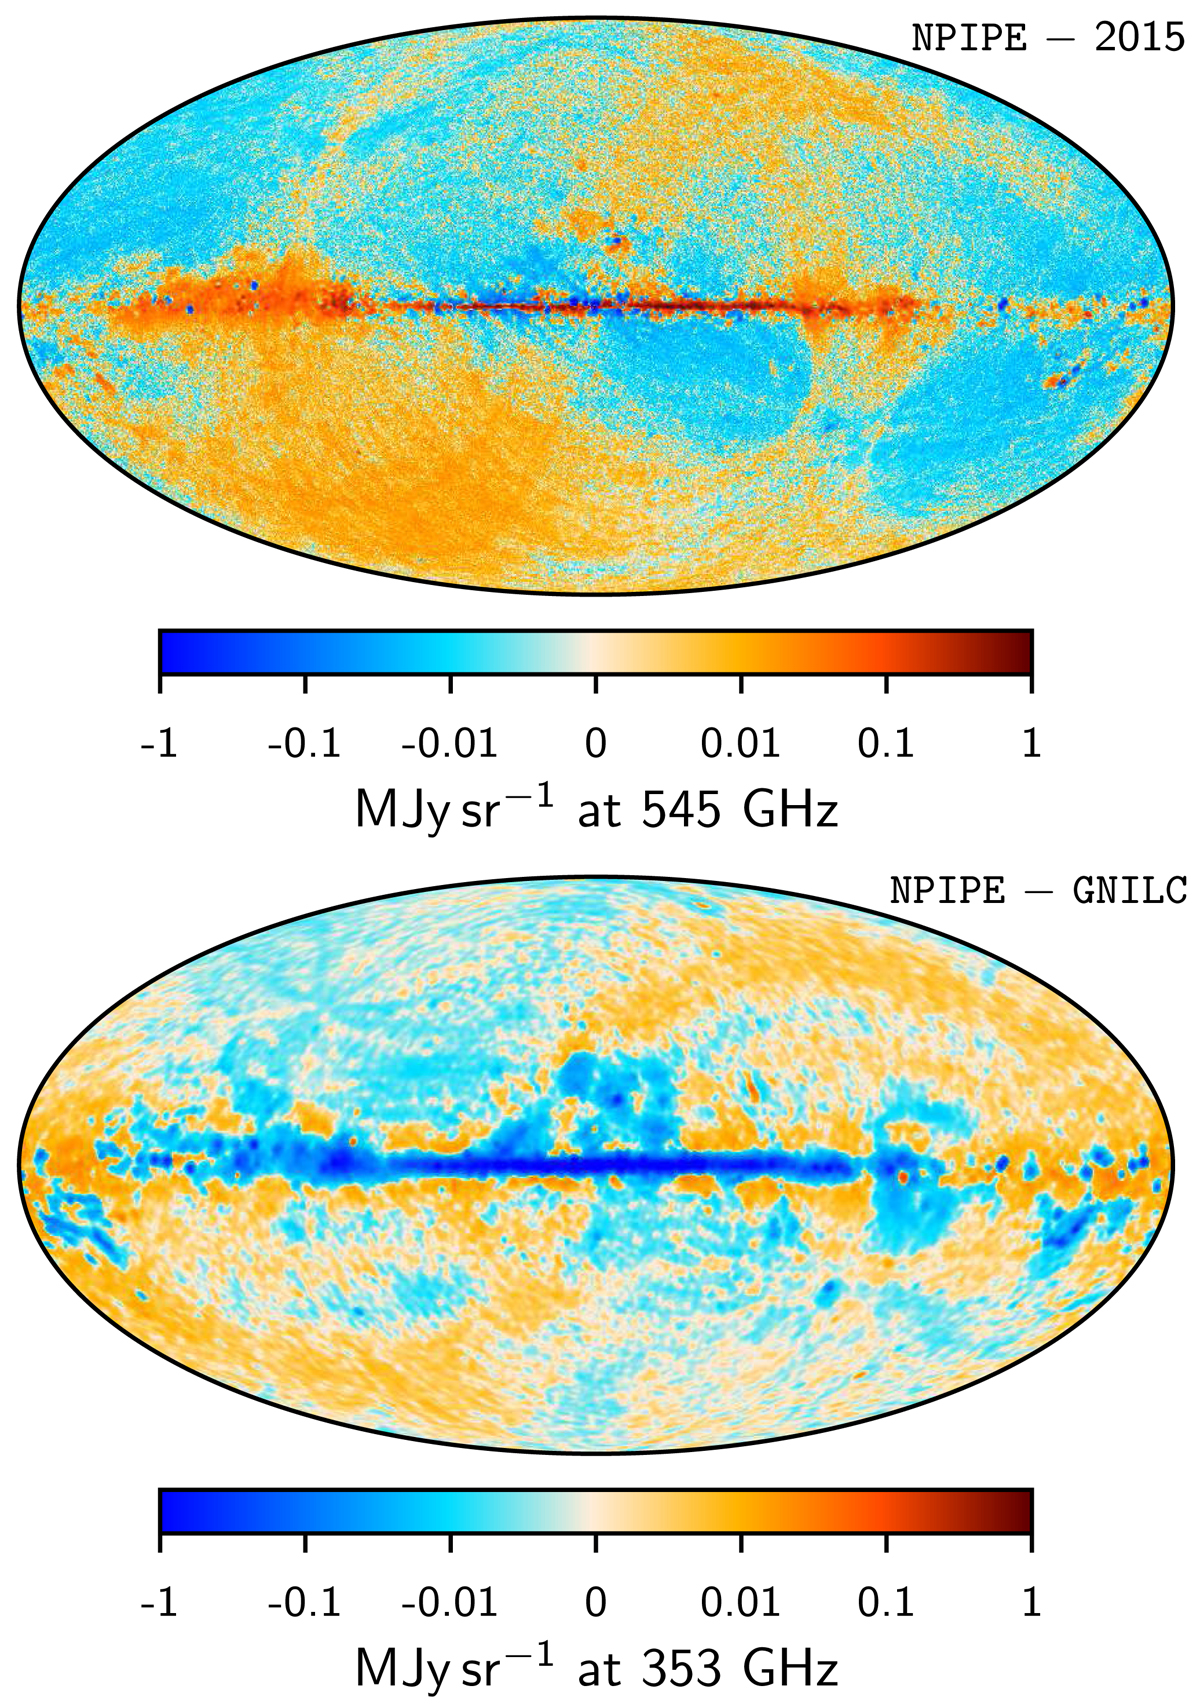
Top: Stokes I difference map between the NPIPE and the Planck 2015 (Planck Collaboration X 2016) dust amplitudes, adjusted for the scaling and offset seen in Fig. 66. Both dust amplitude maps are smoothed to 1° FWHM and pixelized with a HEALPix resolution parameter Nside = 256. Bottom: similar difference plot between the NPIPE dust amplitude map and the GNILC (Planck Collaboration IV 2020) dust amplitudes, adjusted for the scaling and offset seen in Fig. 66. Both dust amplitude maps were smoothed to 80′ FWHM and pixelized with a HEALPix resolution parameter Nside = 256.
Current usage metrics show cumulative count of Article Views (full-text article views including HTML views, PDF and ePub downloads, according to the available data) and Abstracts Views on Vision4Press platform.
Data correspond to usage on the plateform after 2015. The current usage metrics is available 48-96 hours after online publication and is updated daily on week days.
Initial download of the metrics may take a while.