Fig. 61.
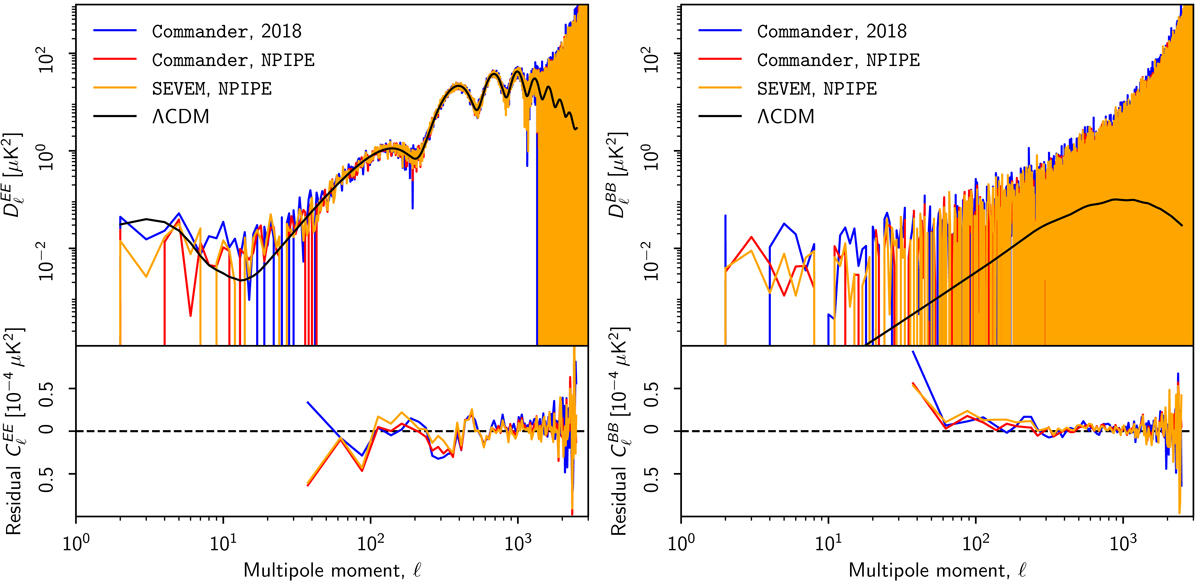
Angular CMB polarization cross-power spectra evaluated from the Planck 2018 (blue curves) and NPIPE (red curves for Commander; orange curves for SEVEM) data sets. EE and BB spectra are shown in the left and right panels, respectively. Within each main panel, the full spectrum is shown in the top sub-panel, while the residuals with respect to the Planck 2018 best-fit ΛCDM spectrum (black curves) are shown in the bottom sub-panels. The latter have been binned with Δℓ = 25. The cross-spectra are evaluated from the most independent data split that is available for each data set, corresponding to the A/B detector split for NPIPE and the half-mission split for Planck 2018.
Current usage metrics show cumulative count of Article Views (full-text article views including HTML views, PDF and ePub downloads, according to the available data) and Abstracts Views on Vision4Press platform.
Data correspond to usage on the plateform after 2015. The current usage metrics is available 48-96 hours after online publication and is updated daily on week days.
Initial download of the metrics may take a while.