Fig. 59.
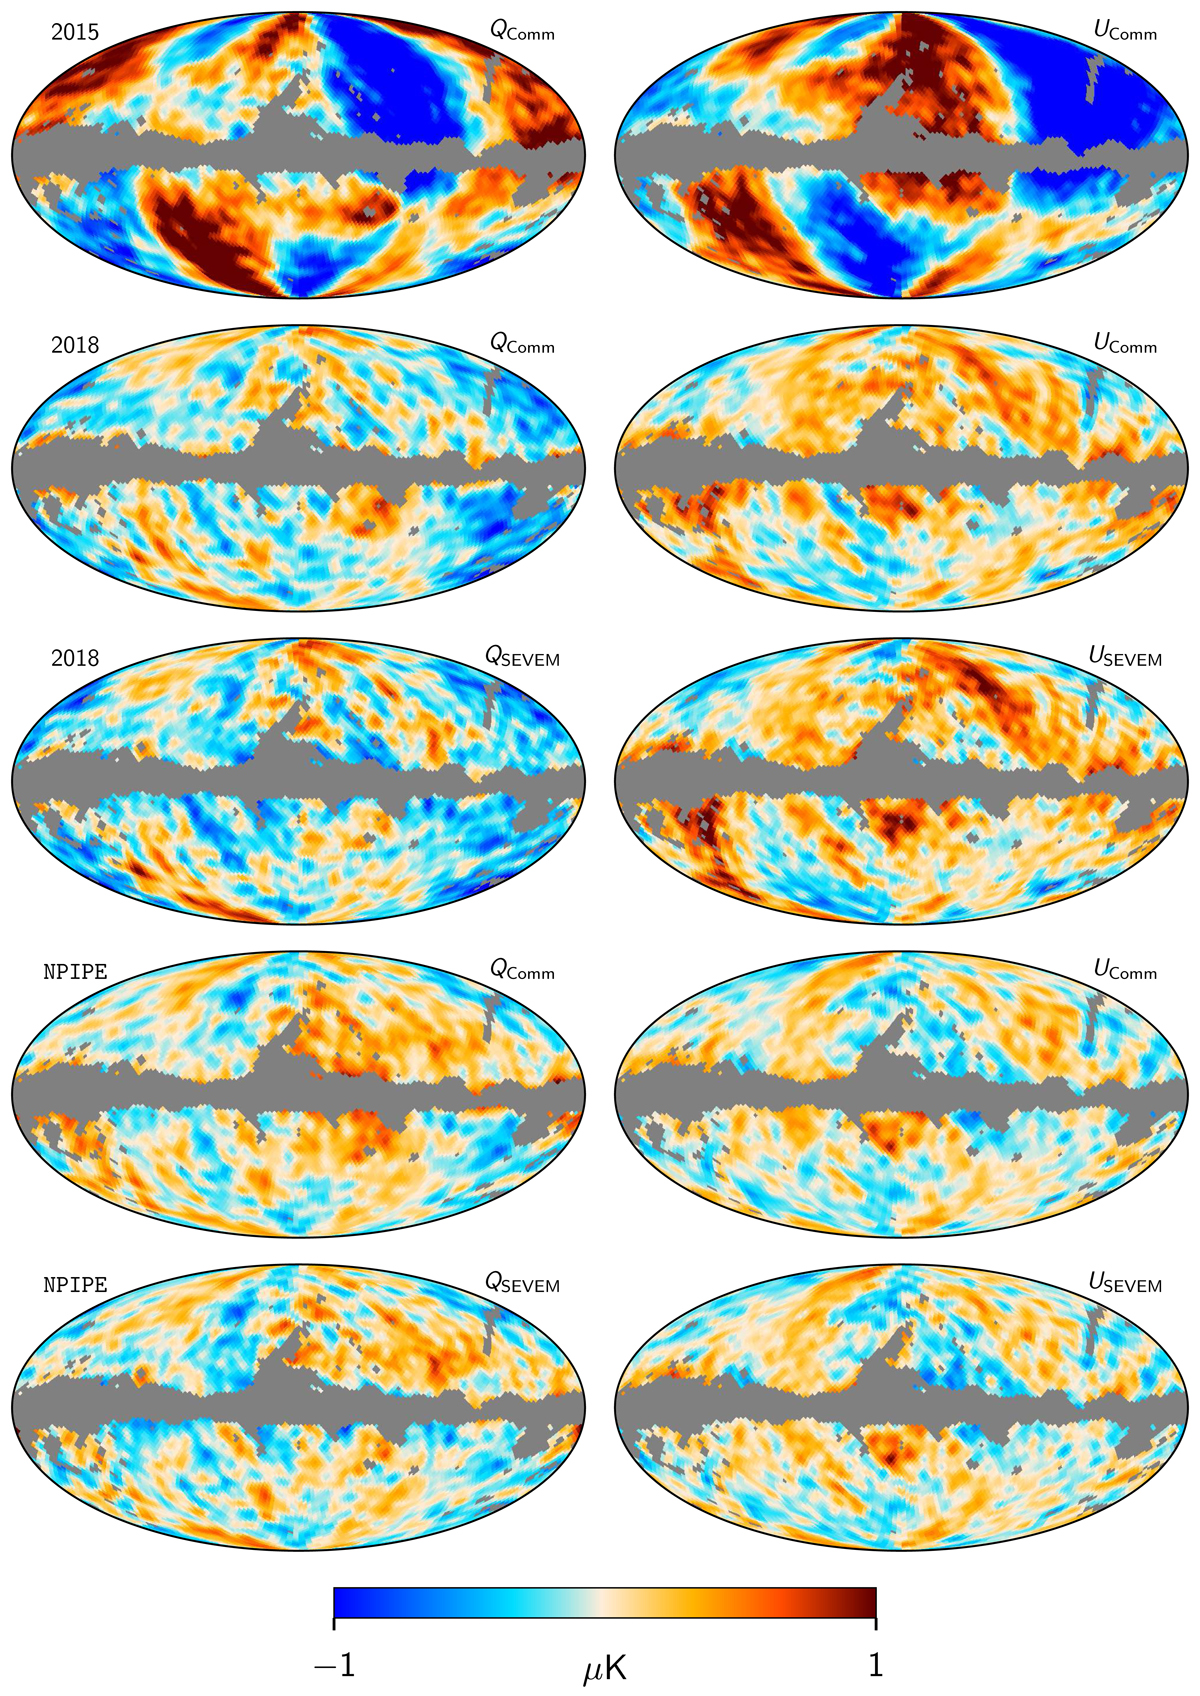
Comparison of large-scale CMB Q and U maps from, top to bottom: Commander Planck 2015; Commander Planck 2018; SEVEM Planck 2018; Commander NPIPE; and SEVEM NPIPE. Note that the large-scale Planck 2015 CMB map in the top row was never publicly released, due to the high level of residual systematic effects. The grey region corresponds to the Planck 2018 common component-separation mask (Planck Collaboration IV 2020). All maps are smoothed to a common angular resolution of 5° FWHM.
Current usage metrics show cumulative count of Article Views (full-text article views including HTML views, PDF and ePub downloads, according to the available data) and Abstracts Views on Vision4Press platform.
Data correspond to usage on the plateform after 2015. The current usage metrics is available 48-96 hours after online publication and is updated daily on week days.
Initial download of the metrics may take a while.