Fig. 57.
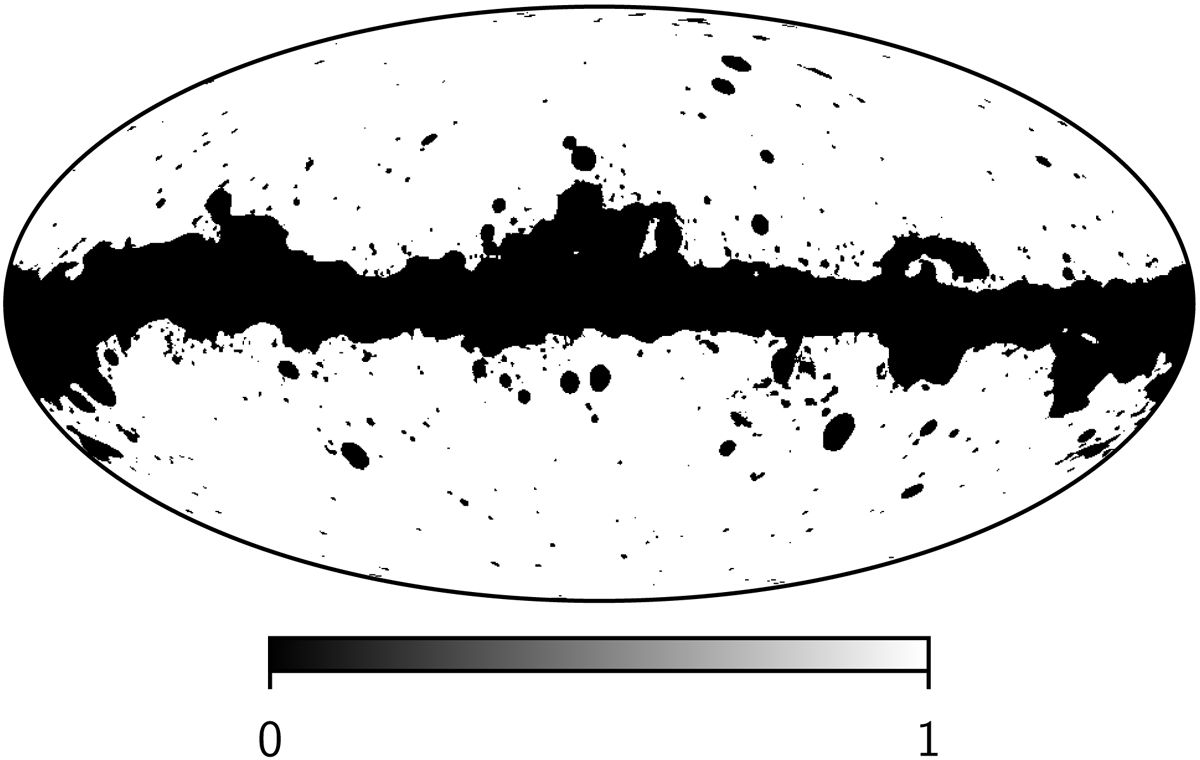
NPIPE CMB temperature analysis mask. This mask is derived by thresholding the standard-deviation map evaluated among the Commander CMB temperature maps resulting from three independent Planck processings (Planck 2015, Planck 2018, and NPIPE), multiplied by another mask, which is thresholded on an overall χ2 cut corresponding to the Commander NPIPE analysis.
Current usage metrics show cumulative count of Article Views (full-text article views including HTML views, PDF and ePub downloads, according to the available data) and Abstracts Views on Vision4Press platform.
Data correspond to usage on the plateform after 2015. The current usage metrics is available 48-96 hours after online publication and is updated daily on week days.
Initial download of the metrics may take a while.