Fig. 55.
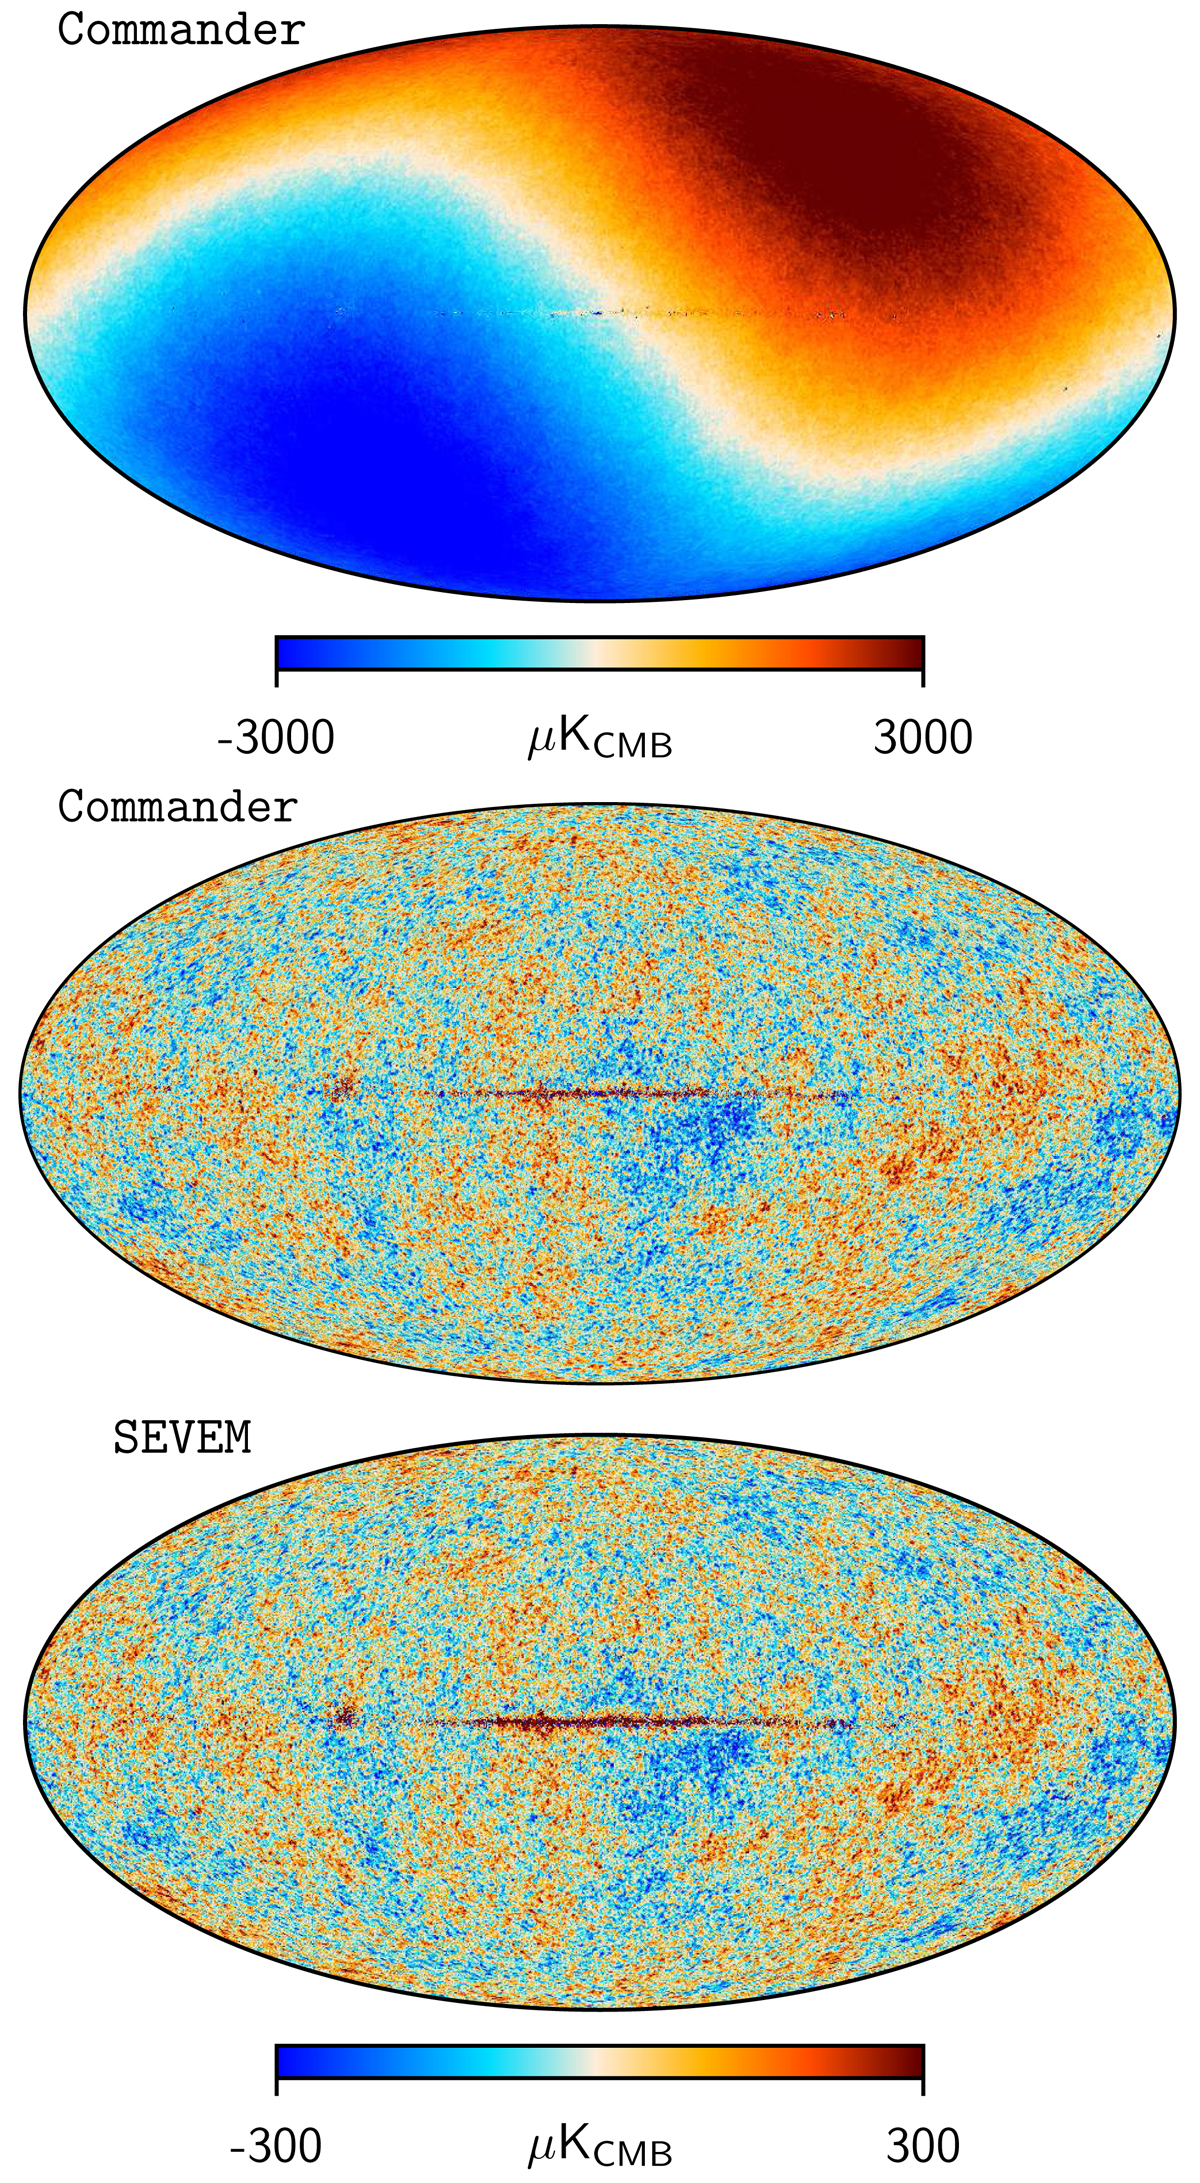
Top: CMB I map derived from the NPIPE data set with Commander, plotted with an angular resolution of 5′ FWHM. The Solar dipole is retained in the NPIPE data set, and in this map. Middle: same as above, but after subtracting the best-fit CMB Solar dipole described in Sect. 8. Bottom: dipole-subtracted CMB temperature map derived with SEVEM.
Current usage metrics show cumulative count of Article Views (full-text article views including HTML views, PDF and ePub downloads, according to the available data) and Abstracts Views on Vision4Press platform.
Data correspond to usage on the plateform after 2015. The current usage metrics is available 48-96 hours after online publication and is updated daily on week days.
Initial download of the metrics may take a while.