Fig. 53.
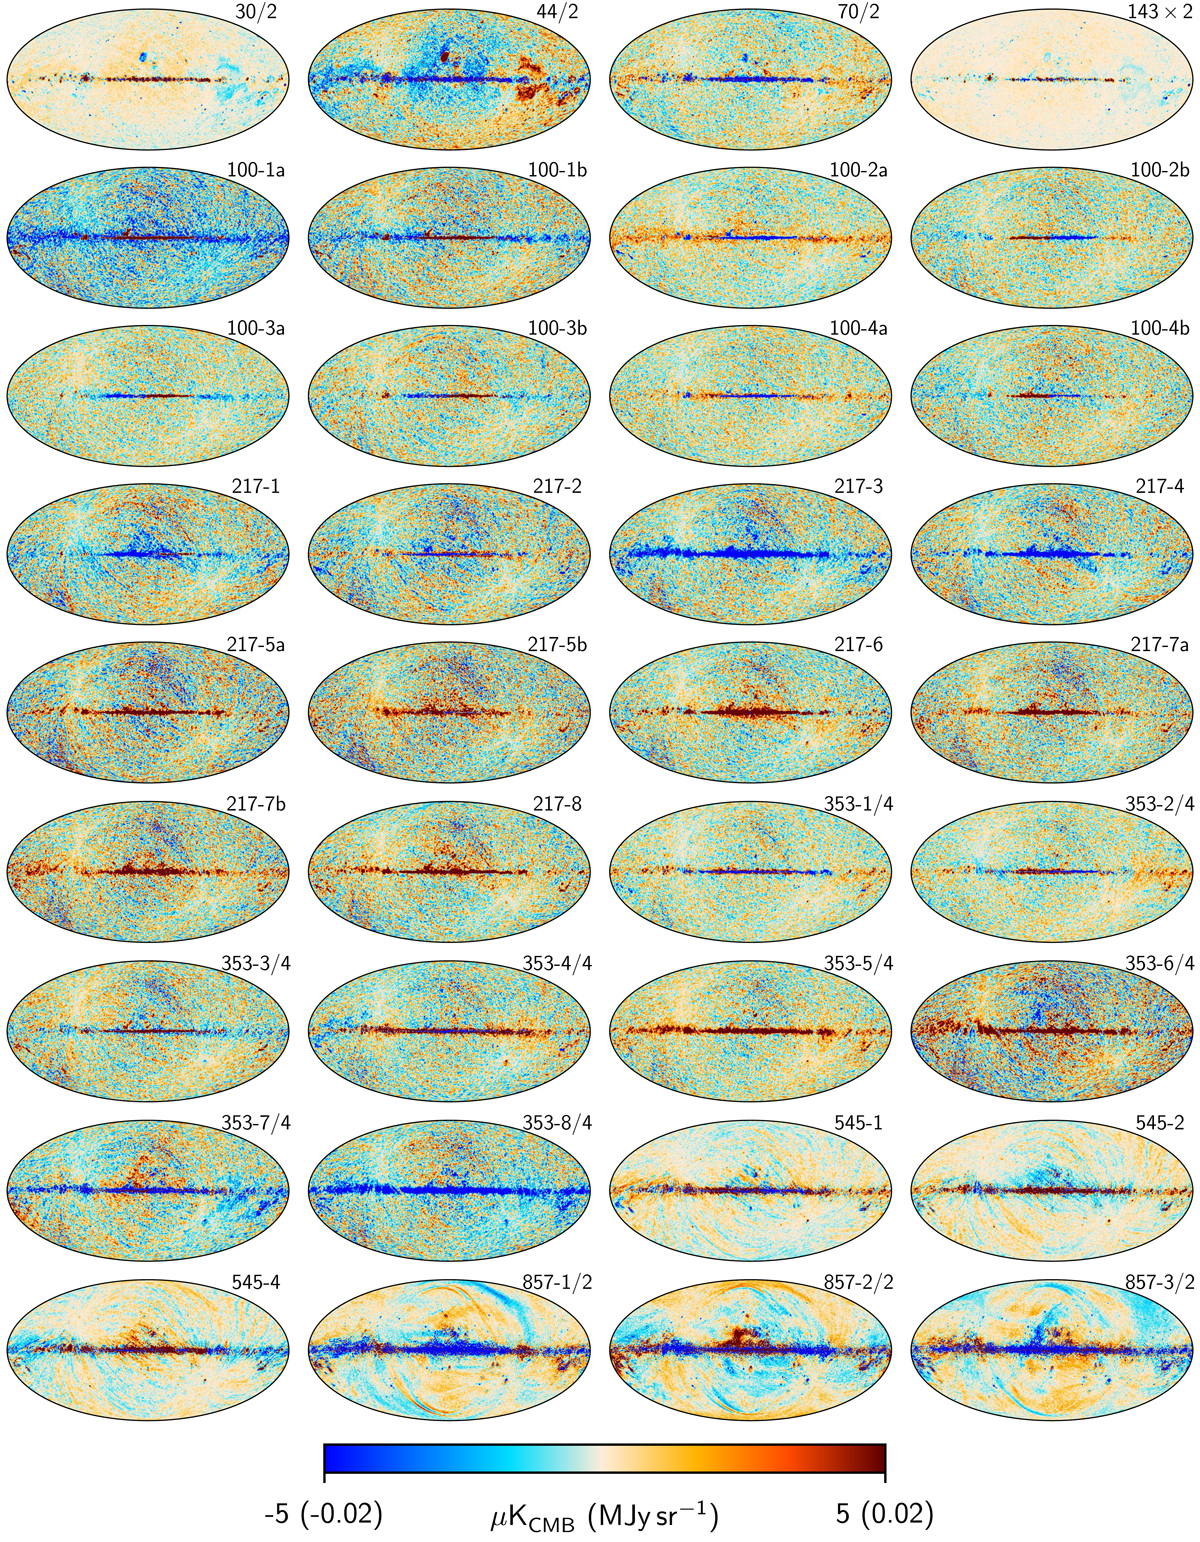
Planck-only NPIPE residual maps for frequency bands and individual detectors. Maps up to 353 GHz are plotted in μKCMB, while maps at 545 and 857 GHz are plotted in MJy sr−1. Maps with a fraction in the label have been divided with respect to the colour bar, while the 143 GHz band has been multiplied by a factor of 2. All maps are smoothed to 60′ FWHM.
Current usage metrics show cumulative count of Article Views (full-text article views including HTML views, PDF and ePub downloads, according to the available data) and Abstracts Views on Vision4Press platform.
Data correspond to usage on the plateform after 2015. The current usage metrics is available 48-96 hours after online publication and is updated daily on week days.
Initial download of the metrics may take a while.