Fig. 46.
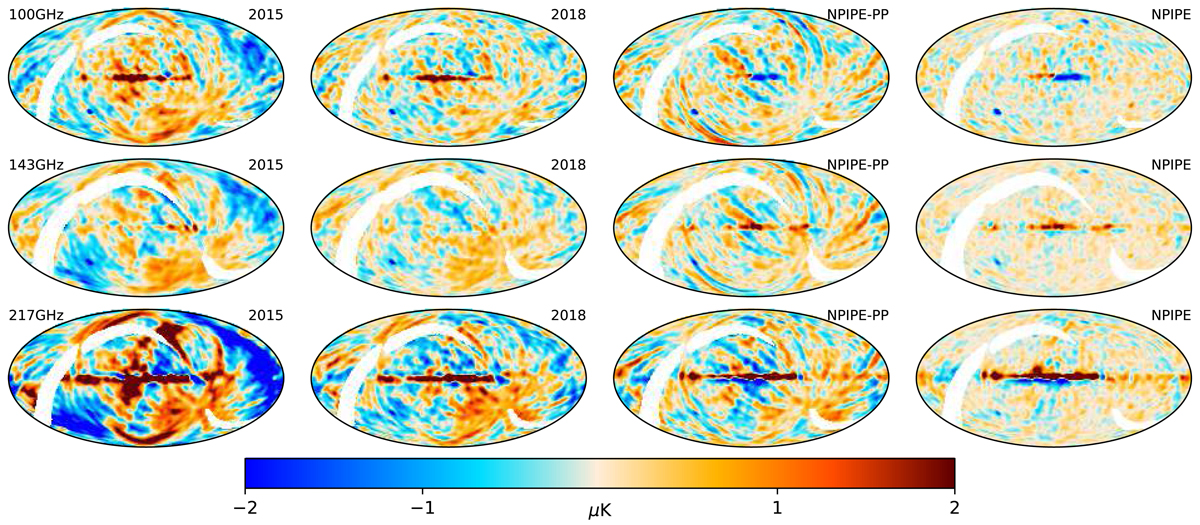
Odd−even survey intensity differences for 100, 143, and 217 GHz, smoothed to 5°. The 2015 and 2018 maps are the same as in Fig. 12 of Planck Collaboration III (2020). The NPIPE-PP column shows the difference obtained if NPIPE is solved only for pointing-period offsets (like PR3), rather than for the 167 ms baseline offsets. The stripes visible in the NPIPE-PP maps are glitch and ADC nonlinearity-correction residuals that are well captured by the short-baseline solution. The comparison is not perfect, because PR2 (2015) baseline offsets were solved using the survey TOD, while the other versions use full-mission baselines. Three variable radio sources can be identified across the frequencies in the NPIPE maps. These maps reflect the internal consistency achieved, not the total residuals, as the calibration errors are correlated between the surveys.
Current usage metrics show cumulative count of Article Views (full-text article views including HTML views, PDF and ePub downloads, according to the available data) and Abstracts Views on Vision4Press platform.
Data correspond to usage on the plateform after 2015. The current usage metrics is available 48-96 hours after online publication and is updated daily on week days.
Initial download of the metrics may take a while.