Fig. 45.
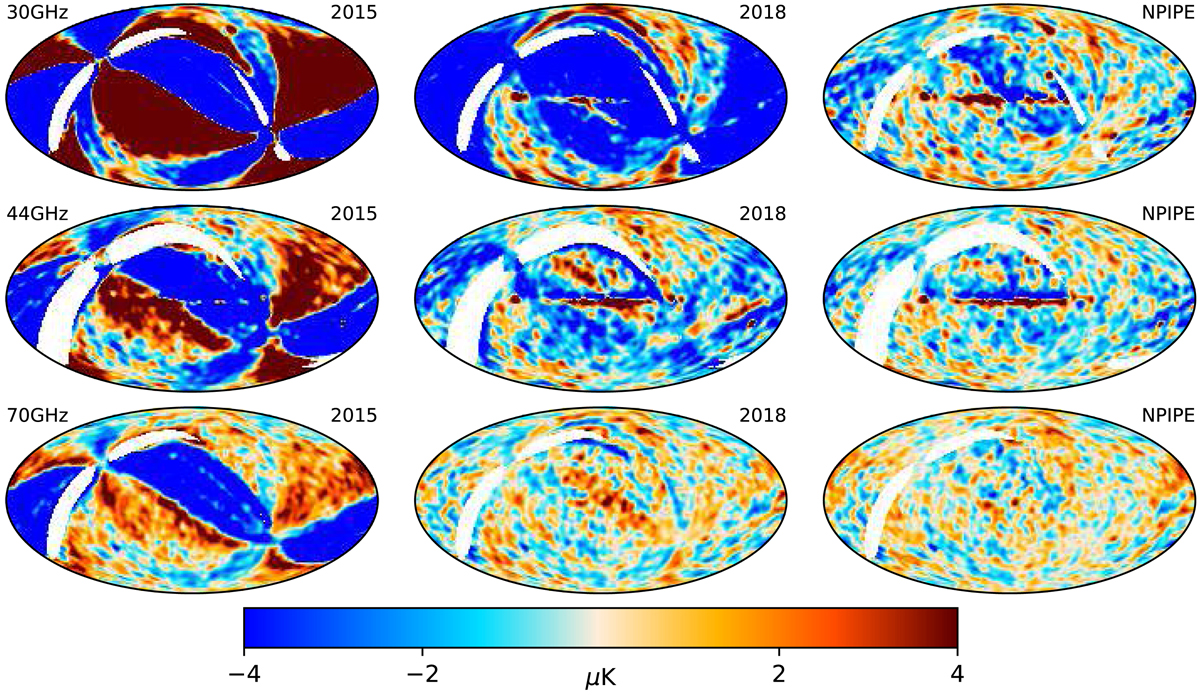
Odd–even survey intensity differences for LFI smoothed to 5°. These maps reflect the internal consistency achieved, not the total residuals, since the calibration errors are correlated between the surveys. To match the 2015 and 2018 processing, the NPIPE 167 ms baseline offsets for this plot are solved using individual survey data.
Current usage metrics show cumulative count of Article Views (full-text article views including HTML views, PDF and ePub downloads, according to the available data) and Abstracts Views on Vision4Press platform.
Data correspond to usage on the plateform after 2015. The current usage metrics is available 48-96 hours after online publication and is updated daily on week days.
Initial download of the metrics may take a while.