Fig. 43.
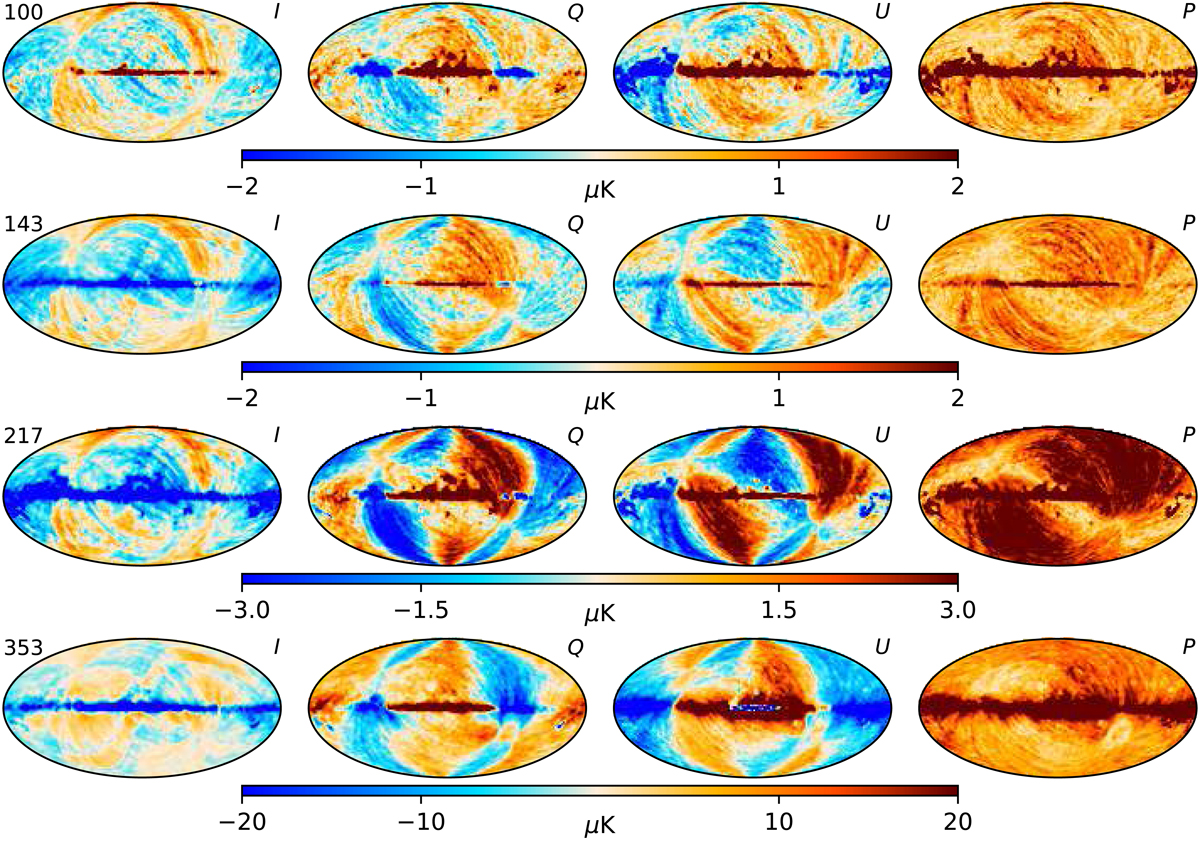
NPIPE−2015 release difference maps in temperature and polarization to compare to Fig. 42. Note that the Solar dipole model for PR2 did not include the frequency-dependent part of the quadrupole term (Table C.1), so we also omit that correction from the dipole template here. The 353 GHz difference shows that the “zebra” pattern is exclusive to the 2018 temperature map. The polarization differences are indicative of an overall calibration mismatch between polarization-sensitive bolometers, causing substantial temperature-to-polarization leakage from the Solar dipole in the 2015 maps.
Current usage metrics show cumulative count of Article Views (full-text article views including HTML views, PDF and ePub downloads, according to the available data) and Abstracts Views on Vision4Press platform.
Data correspond to usage on the plateform after 2015. The current usage metrics is available 48-96 hours after online publication and is updated daily on week days.
Initial download of the metrics may take a while.